
Executive Summary
Effective data management is what underpins the success of any organisation. This webinar works through the various aspects of data quality management and the implementation cycle in a professional setting. Howard Diesel covers data governance and data quality strategy, implementation frameworks, data analysis techniques, and prioritising data management approaches. He makes the case for well-defined outputs, data quality, and cost metrics in data governance, for achieving 100% data accuracy, and for the value data quality brings to company culture. Howard offers the steps outlined in the webinar as guidance for organisations aiming for accurate, reliable data, which in turn supports better-informed decisions and stronger business outcomes.
Webinar Details
Title: Data Quality Framework & Methodologies – Data Citizen
Date: 13 July 2023
Presenter: Howard Diesel
Meetup Group: Data Citizen
Write-up Author: Howard Diesel
Data quality management and implementation cycle in a professional setting
Paul and Howard opened with a discussion on whether a test is needed to determine readiness for a specialist exam, before Howard Diesel got the webinar underway by making the case for understanding various thought leaders and frameworks, DAMA DMBoK and the Juran Trilogy among them. He challenged the audience to choose or build their own combination of methodologies and frameworks and be ready to explain their choices.
From there, the discussion moved to data citizens and the implementation cycle, where Howard worked through critical data elements, impact assessment, and profiling tools for data quality expectations and rules. Next steps covered defining a process for data quality expectation and initial assessment, architecture for data quality, and examples from the Canadian Institute for Health Information, and Howard offered to revisit earlier sections if anyone needed a recap.

Figure 1 DQ Framework Essential Concepts
Data Governance and Data Quality Strategy
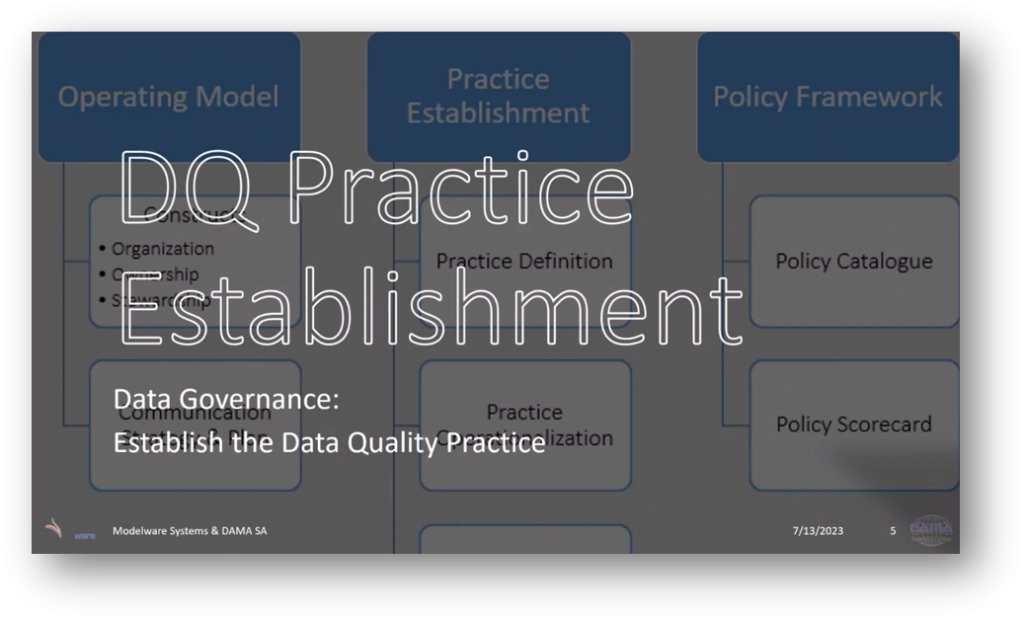
A participant asked for a quick recap, and Howard obliged, making the case for establishing a proper data quality practice within data governance and explaining the hierarchy of business, data, and data management strategies. He stressed that data strategy should align with and derive from business strategy, and discussed the role data quality plays in actually implementing that strategy. He also worked through defining the data quality domain, along with the operating model, principles, policies, procedures, and reference architecture within data governance.

Figure 2 DQ Practice Establishment

Figure 3 DQ – Data Quality Game Plan
Data Governance and Implementation Framework
Procedures matter a great deal for implementing policies that actually align with business requirements and technology. Operationalisation means training people and making sure everyone understands their roles and responsibilities, and DAMA’s work helps standardise procedures across domains and business units.
Assurance is what marks progress and keeps the data governance process optimised, and policies and procedures should sit within a policy framework and get reviewed regularly. Implementation frameworks like ISO 8000-61, Six Sigma, and the Juran Trilogy each bring a different approach, certification, standardisation, quality control, and waste reduction respectively.

Figure 4 Definition: Quality Management Framework

Figure 5 Comparative Perspectives
Areas to Compare in Data Quality Analysis and Improvement
Howard made the case for comparing different frameworks as a way to improve data quality, suggesting a look at the types of costs tied to data quality issues, since cost reduction is often the strongest argument for convincing senior management. His suggestion is to keep evaluating and improving data quality continuously, identifying different data quality services worth evaluating and comparing along the way.
Additionally, Howard pointed to the importance of paying attention to the business processes that create, read, update, and delete data, and to the types of data involved, structured data, application data, data warehouses, unstructured data, data lakes. Finally, he recommended weighing the compatibility of different systems and organisational structures, working through the phases and steps involved in data quality analysis and improvement, and figuring out whether the improvement process is process-driven or data-driven, with process-driven improvement tending to be more sustainable in the long run.
Data-Driven and Process-Driven Approaches
Data quality matters a great deal for the accuracy and reliability of data-driven applications, which often means making data fixes or changes to data models that can affect application performance. Understanding the various processes that can affect data quality, and the different frameworks and approaches for building data quality rules, matters too. Conformed dimensions are recommended, and there’s a range of material available on different data types and rule development.
Frameworks vary quite a bit in their approach to rule building and requirements analysis; CDQ is designed to cover all areas, while others leave gaps. Stacked is one example of a framework built for government organisations in Italy. Which improvement steps and strategies make sense really depends on the area or system being worked on, and whether it’s data-driven or process-driven.

Figure 6 Common Steps for Assessment Phase

Figure 7 Improvement Strategies & Techniques

Figure 8 Improvement Strategies & Techniques

Figure 9 Dimensions

Figure 10 Costs of the DQ Program

Figure 11 Considered Frameworks

Figure 12 Comparison of Methodologies & Assessment Steps

Figure 13 Comparison of Methodologies & Improvement Steps

Figure 14 Comparison of Methodologies & Types of Strategies
Quality Dimensions, Frameworks, and Information Systems
The two main frameworks for quality here are Quality, Cost, and Delivery (QCD) and Total Information Quality Management (TIQM). Researcher Carlo Batini created a diagram comparing different quality dimensions, improvement assessments, and costs. Monolithic systems refer to Enterprise Resource Planning (ERP), while distributed systems cover data management, fabric, and warehousing, and cooperative systems get used across different government organisations.
A framework review looks at how different frameworks converge, and Larry English’s TIQM came up too, alongside how the Canadian health organisation CIHI differentiates between data quality and information quality in its own use case. DQA refers to the subjective and objective metrics used to measure quality.

Figure 15 Comparison of Methodologies & English & Loshin Classification

Figure 16 DQ Methodology Classification

Figure 17 Comparisons and Information Systems

Figure 18 DWQ Methodology

Figure 19 TIQM Methodology

Figure 20 CIHI Methodology

Figure 21 DQA Methodology
Implementation Cycle and Data Quality Assessment
Howard Diesel’s suggestion for ensuring high-quality data is harmonising different frameworks for implementation and assessment. Understanding data quality issues and building out metadata, lineage, and organisational structure before assessing data matters a great deal, and he advised against relying solely on predefined business models, pointing instead to the need for reconstructing states and assessing critical data. The assessment itself covers profiling and building out data quality requirements analysis, with the data ultimately evaluated against expectations and data quality rules.

Figure 22 DQ Implementation Cycle
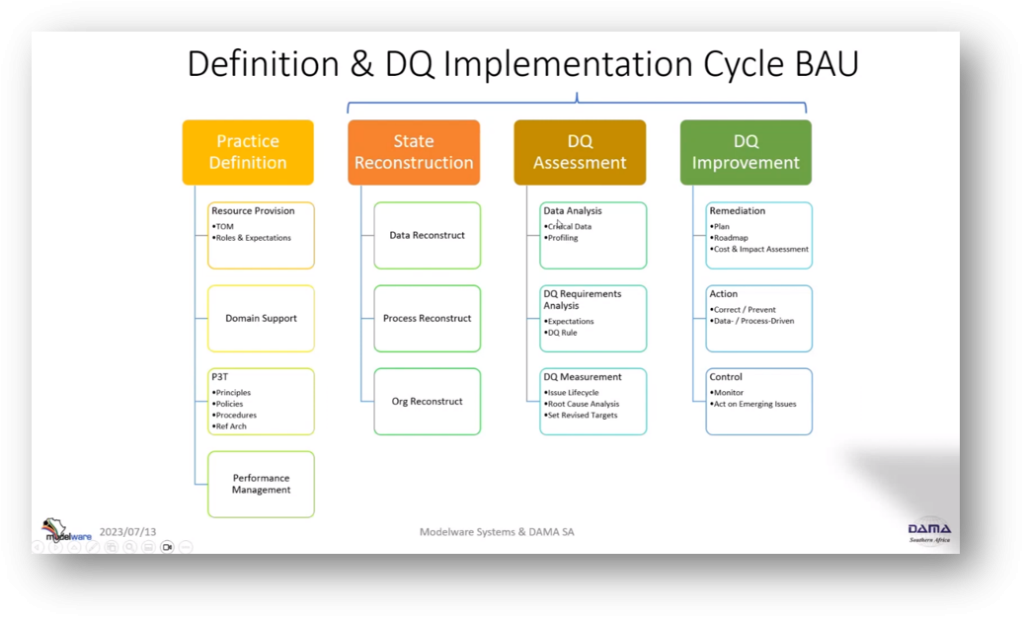
Figure 23 Definition & DQ Implementation Cycle BAU
Importance and Documentation of Data Quality Expectations
The Data Management Body of Knowledge (DMBOK) doesn’t offer much of a deliverable when it comes to data quality expectations specifically. Expectations get established through a combination of business rules, perspectives, and user requirements, and data quality specialists need to extract rules from the business and categorise them accordingly. Measuring data quality is followed by reporting issues and running root cause analysis, and the Pareto principle (80/20 rule) helps address the most significant issues.
Expectations aren’t the measure itself, worth remembering, but the level at which the measure should pass, and people tend to be comfortable specifying data quality rules once that’s clear. Howard Diesel stressed the importance of understanding the perspective and purpose of the dataset, and the need to actually analyse the data rather than rely solely on what the data steward says. An example of data quality expectations was promised for the following week, with the discussion set to continue on critical data elements, decision-making, and data quality rules.
Implementing the DM AIC process for risk assessment and remediation
Howard made the case for a higher level of risk assessment and compliance, brought about through internal audit involvement and running a proper risk assessment. His suggestion is fixing issues and sourcing necessary data from reliable places, drawing on previous experience with industry segmentation.
The implementation cycle itself runs through planning, measurement, remediation, action, and review stages. Howard also made the case for a revised target rather than chasing 100% compliance outright, since that can be unrealistic and lead to missed deadlines. The DM AIC process provides tools and techniques to guide each stage of risk assessment and remediation.

Figure 24 DQ Expectation Template

Figure 25 DQ Expectation Steps for a Data Product
Defining and Analysing Quality, Validating Measurement, and Control
Howard worked through defining quality requirements and listening to customer feedback, with the group identifying outputs, data collection methods, and various ways of analysing data, including the “five whys” technique. Conducting a cost-benefit analysis, using failure mode effect analysis, validating the measurement system, and resetting rules all came up as important, and control methods were shared for achieving target quality levels. The meeting also touched on the data quality specialist exam and the need to exclude tasks that won’t actually be pursued.

Figure 26 Data Quality Improvement Lifecycle “plan-do-check-act”

Figure 27 Six Sigma DMAIC Process for DQ Projects
Quality Control and Process Improvement Techniques
Working through the Juran Trilogy and quality control zones, Howard covers the Pareto principle for waste reduction, the Plan-Do-Check-Act cycle for maintaining quality levels, Statistical Process Control for proactive analysis, root cause analysis methods, and techniques for resolving quality issues while keeping budget constraints in mind. The focus stayed on the assess and improve phase, covering state reconstruction, data analysis, requirement analysis, and measuring quality.

Figure 28 DMAIC Phase & Tool Mapping

Figure 29 CDQ
Analysis of Deliverables and Frameworks in Project Evaluation
Howard walked through the budget required to fix problems, recommending analysing errors, causes, costs, and benefits together. Howard compared various frameworks, PDCA, MAICCDQ, and Juran among them, making the case for unified metadata, data lineage, data models, and business processes in project evaluation.
After reviewing the frameworks, Howard found the Juran Trilogy to be one of the stronger frameworks, built around planning, control, and improvement as its key areas, and also found that state reconstruction, assessment, and improvement produce a better average number of deliverables than PDCA. In PDCA, deliverables cluster mainly in the planning and doing phases, averaging 4.25 per segment of work.

Figure 30 DQ Framework Harmonisation & Analysis
Data analysis and strategy implementation
Howard described the challenges he’s currently facing with his plan, which needs significant upfront work and only a small tail end, while JG acknowledged the value in aiming for the next set of outliers. Howard worked through different frameworks for selecting a strategy and mapping it to standardised outputs, and the conversation also covered various aspects of data reconstruction, obtaining metadata, business glossary definitions, reference data, master data, and data models. Additionally, understanding business processes and data lineage mattered here too, with a reference back to a previous data flow analysis done for data privacy, and the discussion closed on organisation reconstruction and sourcing data from authoritative places.

Figure 31 DQ Practice Playbook
Steps in Ensuring Data Quality and Implementation
The uncertainty here centres on the next steps, particularly when it comes to fixing data or building a database, especially for complex data like postal addresses. State reconstruction matters a great deal and brings real benefits, and the process runs sequentially: assessment, analysis, profiling, requirement analysis, quality measurement, remediation, correction, control.
Data quality assurance and implementation need trend monitoring and metrics review, and data citizens along with business data stewards need to be involved throughout. Different phases call for specific steps and outputs, and it’s worth differentiating clearly between data profiling and assessments.
Data Quality Assessment Process
The key activities data stewards will engage in get outlined here, along with why data quality expectations matter for accurately identifying data issues. There’s a real difference between profiling data through statistical analysis and running a data quality assessment, and issues can crop up during the profiling stage itself.
The acceptability of the min-max range comes up too, along with how profiling results kick off data quality discussions and assessments, and the steps involved in the assessment process, raising and prioritising data quality issues among them. Using the 80/20 rule for data quality priority, running root cause analysis with the fishbone technique, and getting agreement on identified root causes all get covered, along with automated profiling using a SQL Server agent job for regular data profiling.

Figure 32 DQ Implementation Cycle (BAU)
Root Cause Analysis and Documentation Process
Howard outlined the steps to follow when conducting an assessment and identifying root causes, stressing that stakeholders need to be satisfied with those root causes and agree on the chosen course of action first. From there, a remediation plan gets built around the chosen solution matrix, followed by a cost-benefit analysis to work out the expenses and quality improvements the proposed fix would bring.
A failure mode, MoSCoW, improvement, and optimal improvement plan all need creating, along with documentation of the revised DQ target and getting necessary fixes underway. Maintaining that new level of performance matters, and flow charts, critical data element prioritisation, cost taxonomy, and profiling tools all help understand and resolve data-related problems. Findings, in the end, get presented using fishbone diagrams and check sheets, to communicate issues and where they came from clearly.

Figure 33 Choosing Critical Data Elements

Figure 34 Identifying & Prioritising CDEs

Figure 35 CDE Prioritisation
Data Analysis Techniques and Tools
A range of tools can make data analysis easier: checksheets, frequency distribution, histograms, Power BI, Pareto charts, scatter plots, flow charts, box plots. Checksheets help identify and address data-related problems, frequency distribution analyses how data is distributed and flags key areas of concern, histograms present that frequency distribution visually, Power BI analyses data across different segments to identify issues, and Pareto charts help prioritise and focus on fixing the most impactful issues. Scatter plots and flow charts round out the analysis toolkit, and box plots help assess how reasonable the data actually looks. Outliers are worth identifying and quantifying too, since that’s what sharpens expectations and outcomes.

Figure 36 Ishikawa (Fishbone)

Figure 37 Check Sheet

Figure 38 Statistical Control Chart

Figure 39 Histogram of Counts

Figure 40 Frequency Distribution

Figure 41 CDE Histograms

Figure 42 Box Plot – Reasonableness
Discussion on Outliers and Data Analysis
Paul and Howard investigated the root cause of an outlier in their data, weighing the possibility of other out-of-control factors causing the issue. They questioned what was behind the arrival delays, suspecting multiple contracts might be responsible, and Howard presented a histogram showing a significant jump in data during 2020, which led them to conclude the data couldn’t reliably support forecasting all the way to 2050. They discussed how useful the data actually is for analytics and other applications, CDs included, with one person remarking on just how massive the CDs turned out to be.
Prioritising Data Management Approaches
During a discussion on data management improvement, Paul suggested a use-case approach for prioritising and targeting specific areas. Howard agreed, stressing the importance of not tackling too many aspects at once and suggesting instead starting with data warehouse reports or dashboards, a recognisable issue that data citizens can actually trust. Paul agreed that starting with reports made sense and was appreciative of the insight. Additionally, he also warned against starting at the application level, since that tends to drag the process out longer than it needs to be, and pointed to the significance of critical data elements, suggesting reports as a fallback starting point if a use-case approach isn’t feasible.
Decision-making and Decision Inventory
Howard stressed how much critical data elements support decision-making, suggesting that the cost of a wrong decision is worth factoring in when analysing a report. Paul agreed, noting that cost is actually fairly easy to quantify. Howard also raised the challenge of getting all decisions properly defined and the need for scenario planning, pointing to a decision inventory linked to the parties involved in making decisions.
The Importance of Well-Defined Outputs, Data Quality, and Cost Metrics in Data Governance
Clearly defined outputs matter a great deal when comparing different cycles and frameworks, particularly for data quality and governance. Data governance can be genuinely challenging to address, but data quality tends to be relatively easier, largely thanks to business alignment.
Cost metrics can justify the expense of data quality programs once issues are actually quantified, and automation along with the right technology tools matters for fixing data quality issues efficiently. Linking data quality to risk management matters too, for addressing broader risk, though some health professionals still underestimate how much data quality actually matters.
- Executive Summary
- Data quality management and implementation cycle in a professional setting
- Data Governance and Data Quality Strategy
- Data Governance and Implementation Framework
- Areas to Compare in Data Quality Analysis and Improvement
- Data-Driven and Process-Driven Approaches
- Quality Dimensions, Frameworks, and Information Systems
- Implementation Cycle and Data Quality Assessment
- Importance and Documentation of Data Quality Expectations
- Implementing the DM AIC process for risk assessment and remediation
- Defining and Analysing Quality, Validating Measurement, and Control
- Quality Control and Process Improvement Techniques
- Analysis of Deliverables and Frameworks in Project Evaluation
- Data analysis and strategy implementation
- Steps in Ensuring Data Quality and Implementation
- Data Quality Assessment Process
- Root Cause Analysis and Documentation Process
- Data Analysis Techniques and Tools
- Discussion on Outliers and Data Analysis
- Prioritising Data Management Approaches
- Decision-making and Decision Inventory
- The Importance of Well-Defined Outputs, Data Quality, and Cost Metrics in Data Governance


