
Unlocking the Information Product Canvas: Gather Data Requirements in 30 Minutes with Shane Gibson
Executive Summary
This webinar outlines key themes and insights on data management and product development, emphasising the critical role of data modelling and stakeholder engagement in contemporary organisations. Shane Gibson explores the evolution of data roles, governance, and the significance of business analysis and data stewardship. He highlights the application of the Canvas approach in data management and its influence on information product development.
The webinar addresses the importance of a value-added approach to data-driven business strategies, data quality, and service-level agreement expectations. Shane also covers the intricacies of product creation, development strategies, and the complexities of Agile methodologies, providing a comprehensive overview of the interplay between data management and effective business processes.
Webinar Details
Title: Unlocking the Information Product Canvas: Gather Data Requirements in 30 Minutes with Shane Gibson
Date: 2025-07-09
Presenter: Shane Gibson
Meetup Group: DAMA SA User Group Meeting
Write-up Author: Howard Diesel
Contents
Gather Data Requirements in 30 Minutes with Shane Gibson
The Journey of a Data Modeller
Addressing the Challenges of Data Management and Stakeholder Engagement
The Evolution of Data Roles and Data Governance in Organisations
The Role of Business Analysis and Data Stewardship in Organisations
The Concept and Application of the Canvas in Data Management and Information Product Management
Understanding the Impact of Canvas in Information Product Development
A Guide to Implementing and Understanding Requirements
Understanding the Value of Business Information Products
The Importance of Value-Added Approach and Data-Driven Business Strategy
Information Delivery Types and their Importance in Business
Data Sync and Service Level Agreement (SLA) Expectations
Understanding the Process of Data Management and Event Analysis
The Process of Product Creation in Business
Product Development Strategy and Stakeholder Engagement
The Responsibilities of T-shirt Sizing in Project Development
The Complexity of Feature Stories in Agile Development
Data Quality and Source Systems in Business Processes
Product Development and Business Questions
Gather Data Requirements in 30 Minutes with Shane Gibson
Howard Diesel opened the webinar and introduced Shane Gibson to the attendees. Shane shared that in his presentation, he would explore the evolving landscape of data products, highlighting a noticeable gap in data product design and analysis, particularly in the context of DMBoK and BI reports. Additionally, Shane shared that his rebranding of data products to "information products" reflects a belief in their enhanced contextual value. He emphasised the growing significance of data products, driven by their increasing adoption and the need for comprehensive insights.
Shane reflected to Howard the unexpected surge in high-quality data books set to release in 2025, which sparked curiosity about the reasons behind this phenomenon. Speculation arose that the COVID pandemic may have inspired more authors to write, leading to a flurry of publications. The group agreed to explore this further by reaching out to data expert Steve Hoberman for statistics related to publication trends.
The Journey of a Data Modeller
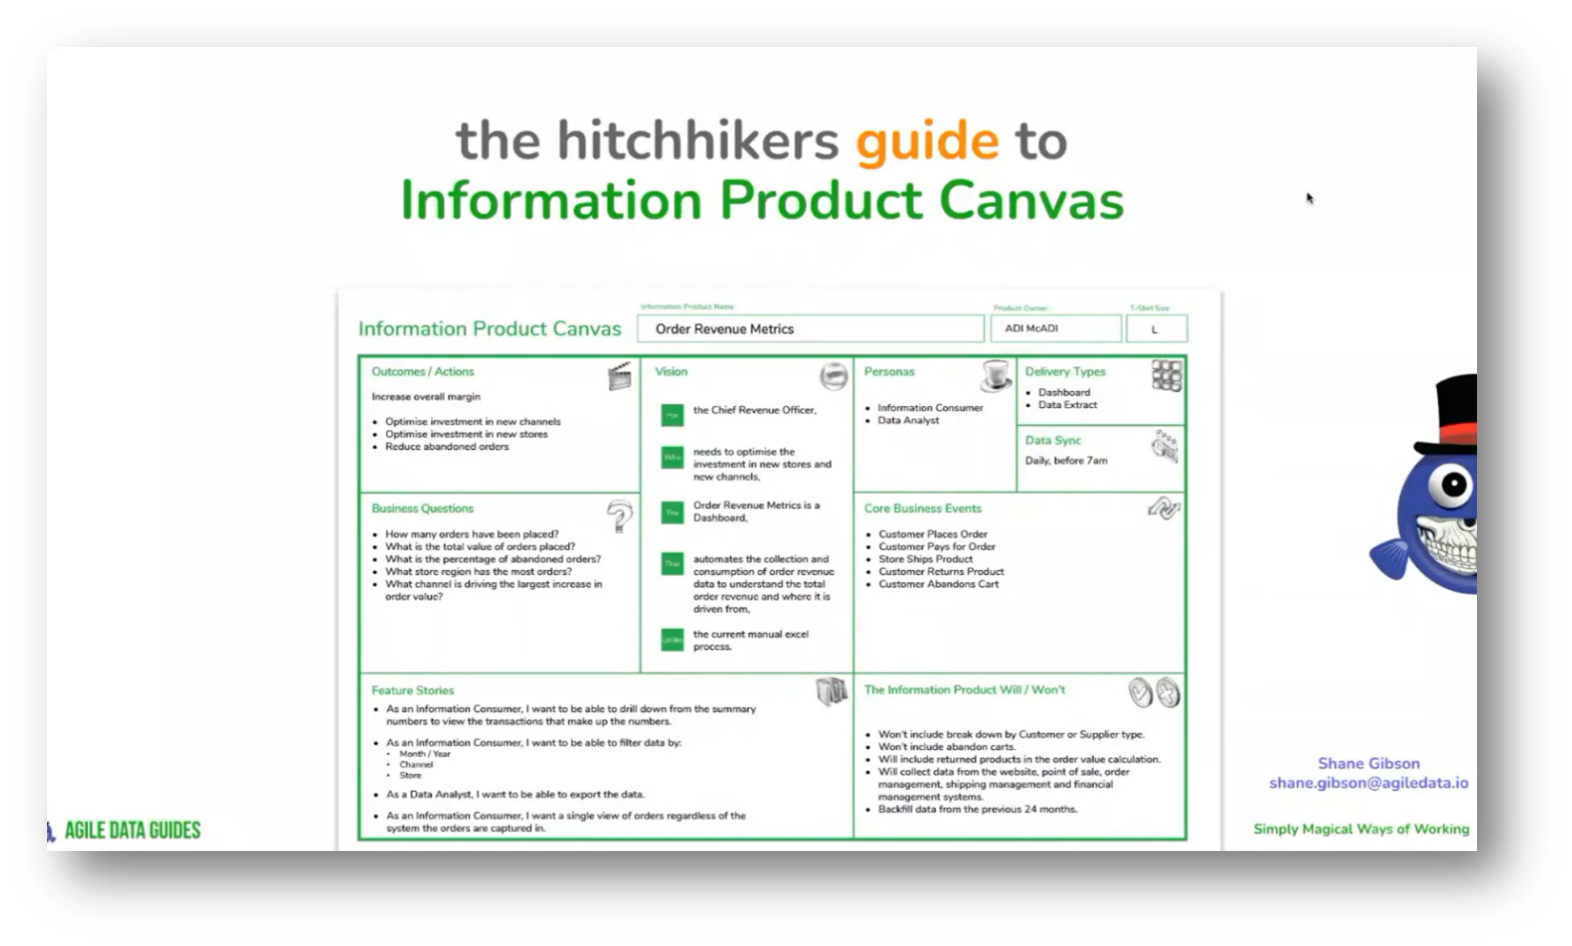
The Hitchhiker's Guide to the Information Product Canvas outlines a structured approach to data modelling, focusing on solving specific problems through a detailed examination of each component of the Canvas. The presentation began with an overview of the Canvas's purpose and the issues it addresses, followed by a breakdown of its parts and their significance.
An example of a completed Canvas would be provided to illustrate concepts effectively. Additionally, Shane shared insights from his 30-year career, beginning in government work on financial systems before the advent of ERP systems, emphasising the importance of timelines in data analysis and modelling. Participants are encouraged to ask questions throughout the discussion.
Shane began his career in the data and business intelligence field, initially working in pre-sales roles at Oracle, focusing on legacy BI and data warehousing tools. After a decade, he founded a consulting company in Wellington, specialising in BI and data consulting for large organisations, including banks and government institutions.
The firm provided end-to-end services, encompassing strategy development, architecture, implementation, and support. However, recognising the limitations of traditional methodologies like the waterfall model, the speaker explored agile methodologies after being introduced to them, leading to experimentation and adaptation within their consulting practices.
Over the past decade, Shane’s career transformed through the integration of agile methodologies with data practices. He dedicated his time to coaching data and analytics teams on enhancing their workflows and co-founding agiledata.io, a platform for collaborative data solutions. Additionally, Shane added that he frequently assists large organisations in developing data blueprints to assess their current state and facilitate improvements in team dynamics and platform functionality.
This experience has enabled him to identify valuable patterns within data and product domains, allowing for iterative experimentation with teams and architectures. Through this collaborative approach, I explore the effectiveness of new strategies, determining their value—whether they enhance performance or not, while distinguishing between innovative patterns and ineffective ones.

Figure 1 The Hitchhiker's Guide to Information Product Canvas
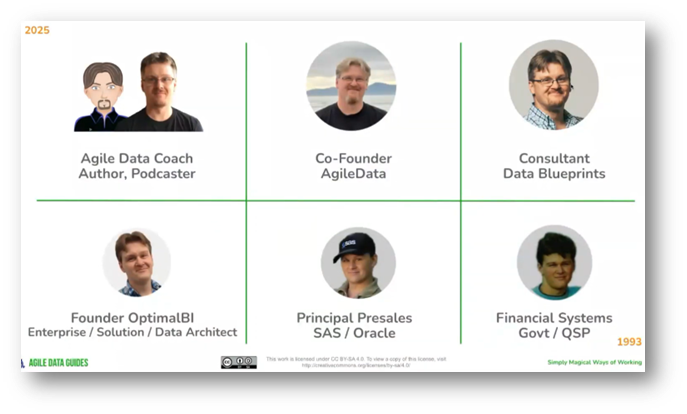
Figure 2 Shane Gibson Data Journey
Addressing the Challenges of Data Management and Stakeholder Engagement
For over 35 years in the data field, Shane shared that a persistent challenge has been the disconnect between stakeholders and data teams during the requirements process. Stakeholders often articulate their needs in terms of specific outputs, such as reports, dashboards, or KPIs, leading to misunderstandings. Consequently, when data teams present their completed work, stakeholders frequently respond with, "That's not what I wanted," highlighting a misalignment in communication.
This issue is exacerbated by delays in processing requests, which can result in stakeholders moving on to different priorities by the time the data team delivers their work. To address this, there is a need for a more efficient and engaging approach to defining requirements, emphasising a shared language that fosters clearer communication and understanding.
Shane discussed the challenge of aligning stakeholder expectations with the realities of data management, emphasising the need for a shared language that bridges these gaps. While stakeholders often reflect on past experiences when articulating their needs, data professionals prioritise the integrity and suitability of source data from systems like HubSpot, Salesforce, and SAP. Furthermore, Shane focused on data modelling, ETL processes, business rules, and data quality to ensure accuracy. The aim is to combine technical language with a more accessible business language, which serves as the foundation for effective communication and collaboration, particularly through the use of tools like the Canvas.
Historically, requirements documents were extensive, often hundreds of pages long, requiring months for stakeholders to review and sign off, which proved inefficient. In the evolving landscape of the modern data stack, there's a notable shift towards concise and actionable requirements, yet many still fall short, providing vague requests instead of clear specifications. Additionally, the recent financial downturn has led to a heightened focus on demonstrating the value of data, pushing data professionals to transition from merely fulfilling requests to understanding and addressing the underlying problems that need resolution. The goal is to strike a balance between detailed requirements and practical, value-driven data solutions, with tools like Canvas emerging to facilitate this understanding.
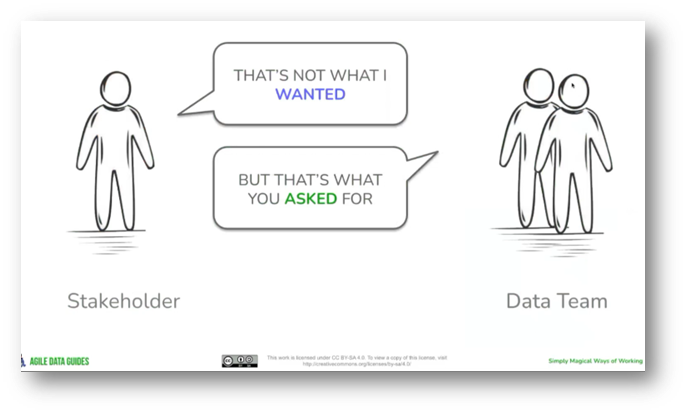
Figure 3 Stakeholder Conversation with Data Team
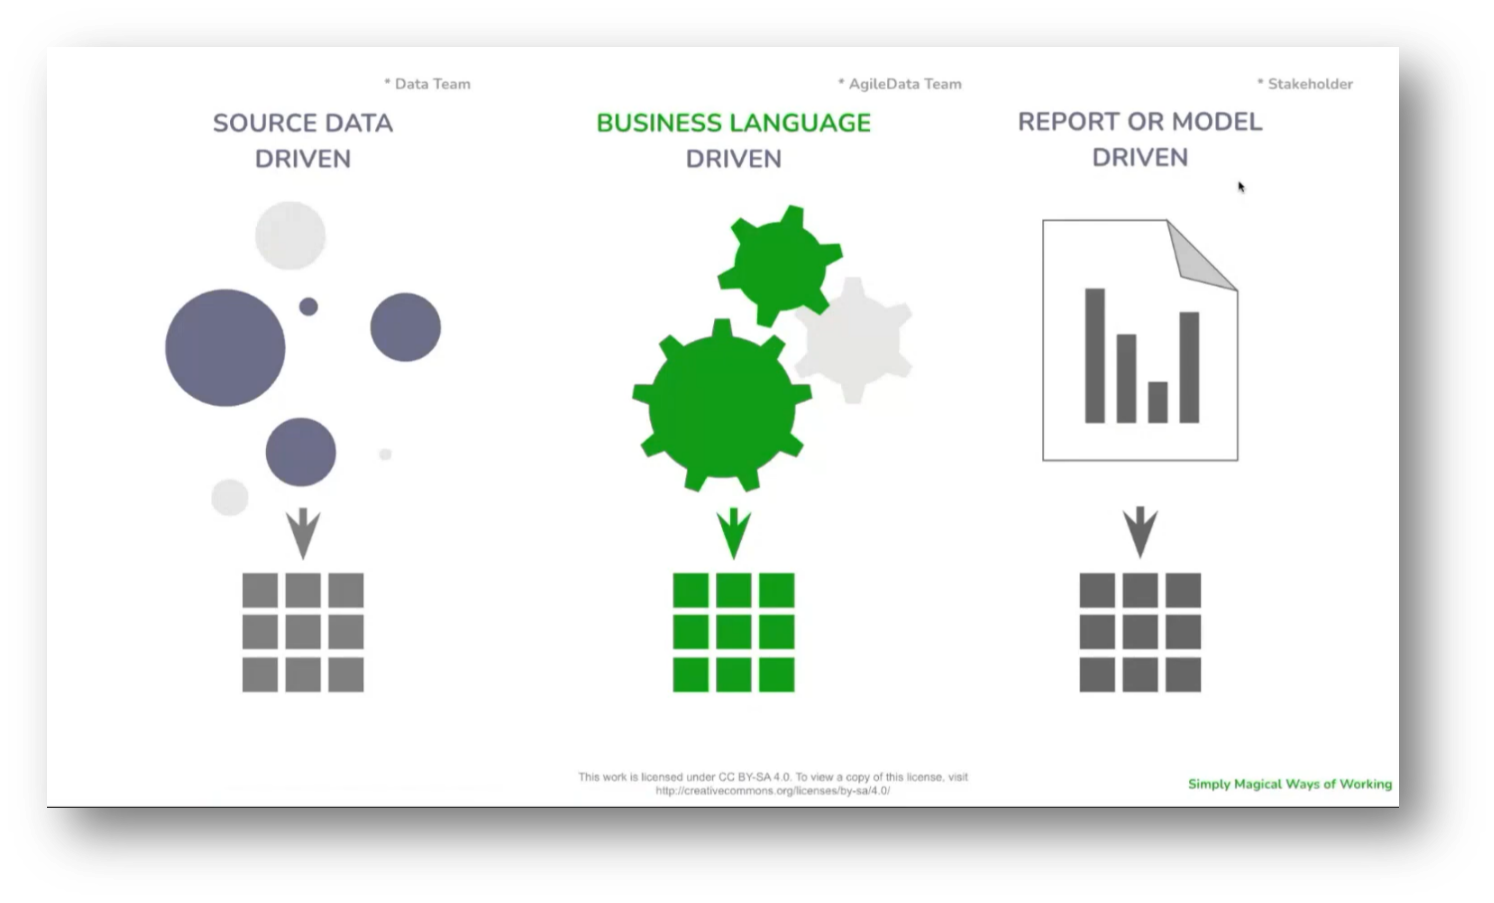
Figure 4 Data Team, AgileData Team and Stakeholder

Figure 5 How we "Used to" Document Requirements
Figure 6 How we "Presently" Document Requirements
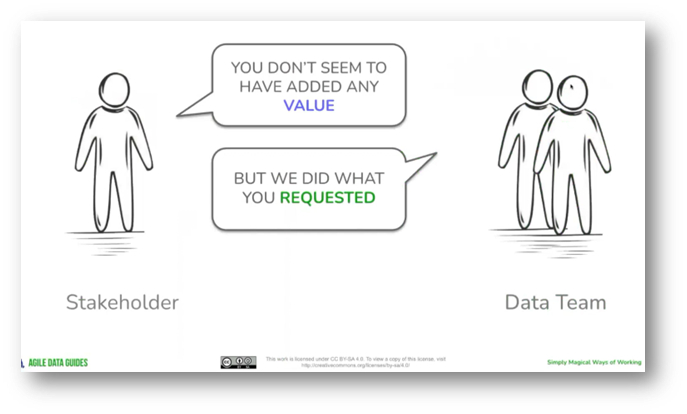
Figure 7 Stakeholder Conversation with Data Team Pt.2
The Evolution of Data Roles and Data Governance in Organisations
There is a noticeable trend of teams being downsized, leading to the disappearance of traditional roles such as business analysts who primarily focused on gathering requirements. As a result, data teams are shifting toward a T-shaped skill model, where professionals, such as data engineers, must expand their expertise beyond their core competencies. They are now expected to understand and gather requirements effectively.
This transformation highlights the need for tools and frameworks, such as a facilitation Canvas, designed to assist those who are not typically involved in facilitation and requirements gathering, enabling them to navigate these tasks with confidence and safety.
Shane highlighted the evolving role of data stewards, particularly as business analysts face layoffs. While some regions, like New Zealand, may lack a significant presence of data stewards due to smaller organisational sizes, there is a growing recognition of their importance. Furthermore, data stewards are increasingly taking on responsibilities related to data management and its usage. Shane noted that data governance should not be viewed as a one-time project but rather as an integral aspect of an organisation’s ongoing operations and culture, requiring continuous attention and adaptation.
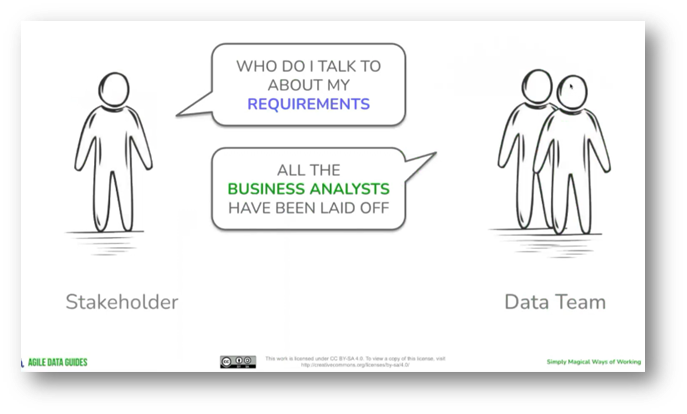
Figure 8 Stakeholder Conversation with Data Team Pt.3
The Role of Business Analysis and Data Stewardship in Organisations
Business analysts and data stewards have seen a decline in their roles, shifting from being key players in process change and problem-solving to tasks such as creating and managing JIRA tickets. This shift has led to a perception that while business analysts can identify issues within organisational systems, they are often sidelined in implementing solutions. Similarly, data stewards are tasked with documenting data but lack the authority to invoke meaningful changes, such as modifying validation criteria in source systems. As a result, both roles are increasingly viewed as constrained by their responsibilities, lacking the necessary accountability and power to effect real change.
Shane highlighted the increasing vocalisation of data stewards regarding challenges related to data quality. They have been proactive in identifying issues and proposing solutions but are often limited in their accountability for the data they manage. There is a recognition that, while they are responsible for reporting errors, more empowerment and engagement are needed. Furthermore, in the South African context, an attendee shared that many data stewards may be too passive, requiring further development to create a meaningful impact in their roles.
The challenges of fostering collaboration between data teams and business stakeholders, particularly in the absence of dedicated business analysts, were highlighted. A key concern is establishing rapport between data professionals and business individuals, as there can be a perceived divide due to organisational structures. To address this, it is suggested that embedding business analyst skills within the data team can create a seamless end-to-end capability, reducing handoffs and enhancing communication and collaboration. Additionally, the approach emphasises the importance of engaging and facilitating discussions between data personnel and business stakeholders to improve overall project outcomes.
The success of a team often hinges on its ability to work collaboratively; yet, many organisations struggle to facilitate this due to traditional hierarchical structures. According to Conway's Law, a team's output reflects its organisational design, making it challenging for self-organising teams to thrive.
While some product owners and business stakeholders are eager to engage in this process, others may feel it's outside their role to become more involved. To foster greater participation, it's crucial to motivate these individuals and emphasise the importance of their engagement in the agile framework, particularly as product ownership has its roots in Scrum methodologies.
The role of the product donor in Scrum has evolved from merely acting as an interface between the team and stakeholders to a more comprehensive approach in product management. This shift emphasises understanding the value of products and being accountable for prioritising those that deliver the most benefit to the team.
Discussions around architecture and terminology continue, highlighting the importance of a common understanding of roles within the data team. While business analysis may be recognised as a distinct role, the underlying skills associated with it remain essential, ensuring that, as roles change or disappear, the necessary competencies still contribute to the team's success.
The role of data teams has evolved significantly, with many now taking on the responsibility of facilitating and analysing business requirements and problems. It's essential to recognise that the skills, functions, and responsibilities of business analysts can vary significantly between organisations, even if they share some commonalities. This diversity in roles can lead to different expectations and responsibilities in different settings.
The Concept and Application of the Canvas in Data Management and Information Product Management
The primary goal of the Canvas is to facilitate a shared understanding of requirements among diverse stakeholders, whether in small organisations with a single data team or larger ones with multiple roles such as data engineers, product owners, and analytics professionals. Additionally, by creating a common language, the Canvas enables effective collaboration across various functions within an organisation involved in data management and product development. Originating from the book "Business Model Generation," the Canvas serves as a valuable tool for visualising and comprehending business models through a structured diagram.
The Canvas developed for capturing business elements such as revenue, expenses, target customers, and competitive markets has been made available under a Creative Commons license, allowing users to modify and customise it while honouring the original creators. Users can modify aspects such as logos, colours, and box labels, as long as they retain the Creative Commons attribution.
Over the past decade, the author has focused on customising this Canvas specifically for data and analytics requirements, continuously testing and iterating it through coaching sessions with various teams and organisations to enhance its effectiveness.
Shane then reflected on his journey with the concept of an "information product," a term they adopted a decade ago while collaborating with Gehard de Beer at New Zealand's Tertiary Education Commission. He expressed a reluctance to make significant changes to their established Canvas due to its extensive history of engagements.
Currently, Shane is involved in developing an AI agent version of the Canvas, which they acknowledge is a different approach. He highlighted the importance of the term "information product," noting its long-standing relevance in their work, despite uncertainties surrounding its origin.
An information product is defined as a comprehensive product that embodies the key characteristics typical of products in other domains, such as software engineering. It integrates the source code, analytics, and visualisation within a defined boundary, allowing for the complete removal of related components without loss of functionality. Unlike mere data, which consists of uncontextualized lists of values, information products deliver context-rich insights that enable users to take action. Ultimately, these actions should lead to measurable outcomes that generate business value, reinforcing the notion that the primary purpose of an information product is to facilitate decision-making and drive results.

Figure 9 Shared Language

Figure 10 Information Product Canvas
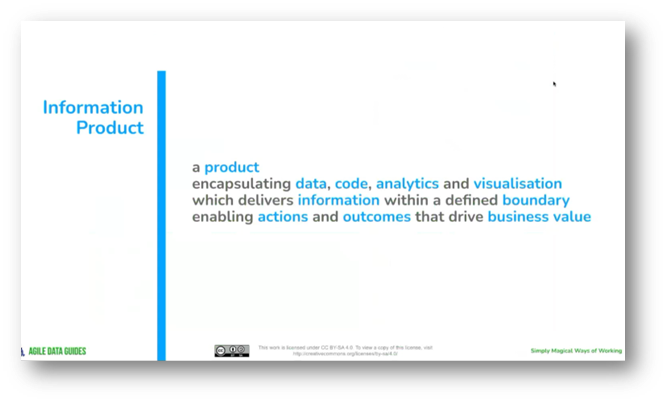
Figure 11 "Information Product"
Understanding the Impact of Canvas in Information Product Development
The Canvas serves as a template for quickly discovering the requirements for information products, to complete this process in 30 minutes or less during initial stakeholder meetings. While the first session may take approximately 45 minutes due to explanations, the Canvas ensures that the requirements captured are repeatable, resulting in consistent outputs regardless of the individual populating it.
Stakeholders generally appreciate the efficiency of this approach, preferring a concise, 30-minute engagement over longer workshops. Ultimately, the Canvas enables data teams to clearly understand what needs to be built and why, facilitating the development of information products with a solid foundation. At the same time, additional details can be gathered as the project progresses.
Shane highlighted the distinction between a product, which is the final output, and a business Canvas, which serves as a template for capturing requirements and business needs. An important preliminary step before utilising the Canvas involves understanding customer personas and their needs, including their challenges and struggles. Persona mapping is a key component of the Canvas.
The application of the Canvas may vary based on the context; for instance, one team used it in a Greenfield environment to address a legacy platform that had become outdated over 20 years, selectively filling out certain sections of the Canvas to prioritise their development backlog.
The project began with domain mapping and grouping of Canvases and products, leading to the selection of a primary domain to focus on. The team progressed by delving into the specifics of the Canvas, emphasising the flexibility of use, whether lightly at the start or in greater detail mid-project. Interestingly, the original concept was presented as a brief in the form of a Word document, which later evolved into a more visual format featuring a couple of boxes on a slide.
The transition from a lengthy, content-heavy Word document to a Canvas format significantly improved stakeholder engagement within the data teams. Initially, the focus was predominantly on design and delivering value to stakeholders, often neglecting earlier phases of engagement. However, by adopting the Canvas approach, teams began to emphasise understanding the problem space and generating feasible solutions through discovery. Additionally, this shift allowed for more effective collaboration, facilitating the identification and prioritisation of viable ideas before moving into the design phase, ultimately adding substantial value during the discovery stage.
The process involves identifying an individual with a problem and engaging in a conversation to understand the issue and explore how data could address it. Lastly, the value of updating the Canvas at various stages will be discussed further as the Canvas is explored in detail.
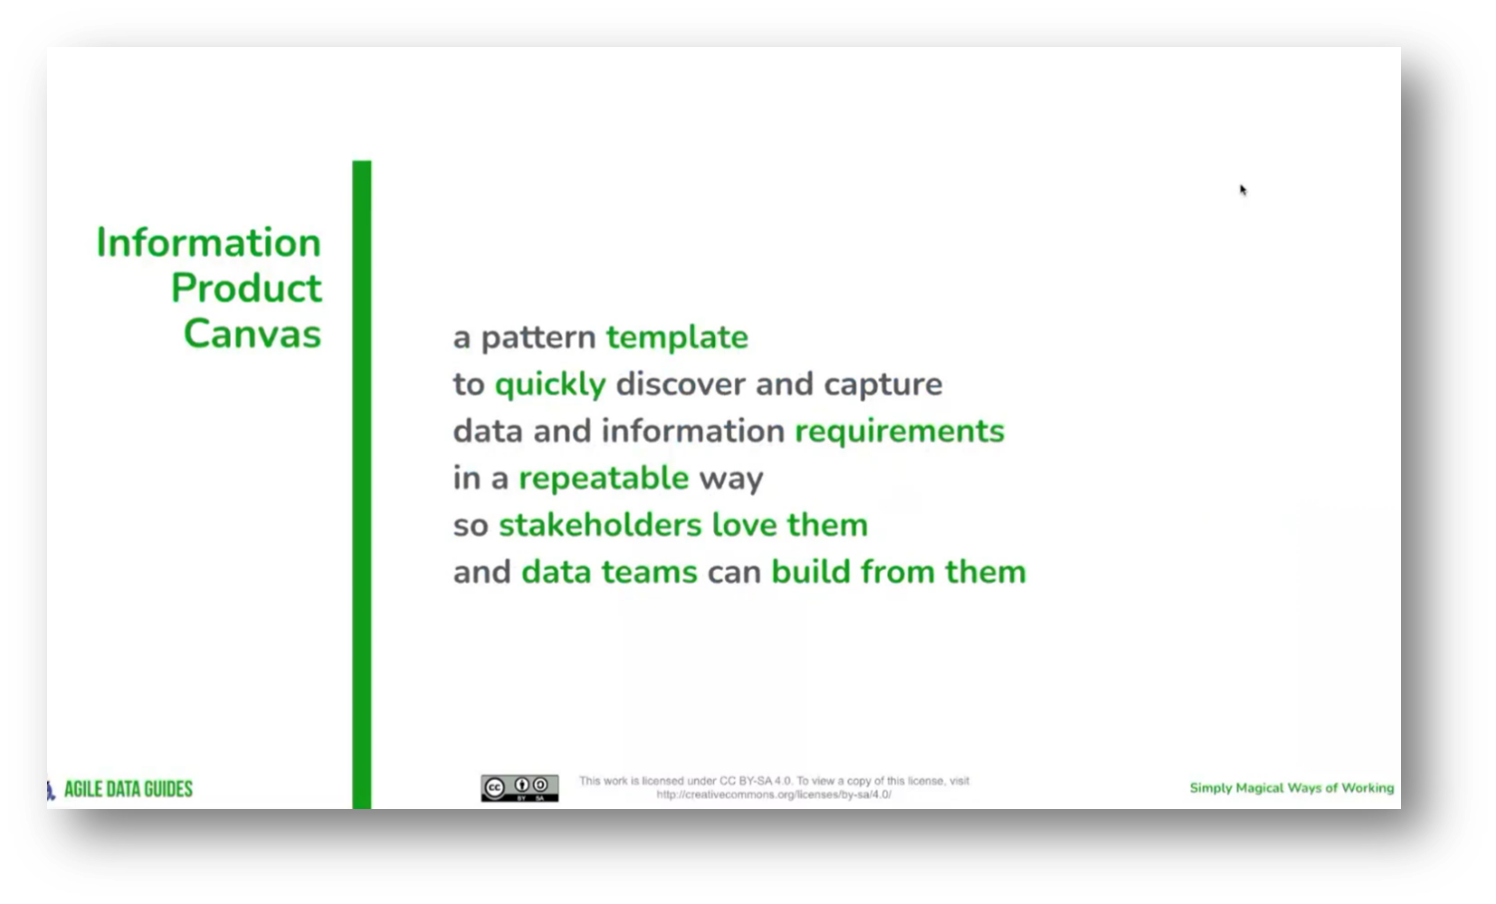
Figure 12 "Information Production Canvas"
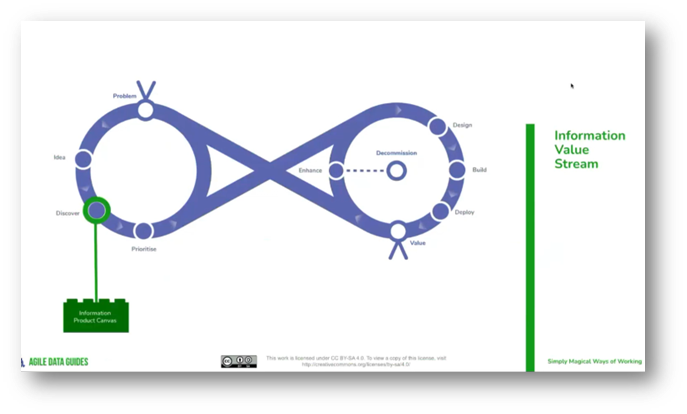
Figure 13 "Information Value Stream"
A Guide to Implementing and Understanding Requirements
The Canvas comprises 12 areas that can be filled out in any order; however, the most effective sequence I've found is to start from box one and progress systematically to box 12. This method has been refined through experimentation and aligns with the approach outlined in the accompanying book and my teaching practice. I will begin with the first box, which focuses on the business question, and pause periodically to address any questions that may arise as we move through each section.
During stakeholder workshops, I often ask participants to identify specific business questions they want answered through data, focusing on quantifiable aspects such as "how many," "how long," and "why." Stakeholders might respond with clear, actionable questions or vague inquiries, such as "How's the business doing?" In such cases, I clarify that I'm seeking specific metrics, offering examples like "how many orders have been placed" or "what is the total order value."
This typically prompts stakeholders to provide essential questions they’ve been eager to discuss. Shane then emphasised that during the discovery phase, we aim for quick requirements to understand the overall problem space rather than delving into exhaustive details. Additionally, considerations around data privacy and partnerships may arise, especially when accessing data from different geographical locations within a global group.
When handling confidential or restricted data, it's essential to collaborate with data security and compliance teams to ensure the metrics can effectively drive business decisions. Requirements related to data protection, such as masking personally identifiable information (PII), should be noted without delving into extensive details.
The focus during the initial phase is on discovering requirements, not on design, which is facilitated by a constraints model that encourages quick assessments within a 30-minute timeframe. This approach prevents premature deep dives into potential issues, reserving detailed discussions for later when the requirements are being prioritised.
The product in question is consistently deprioritised, resulting in its non-development and the introduction of waste into the process. It is crucial to find a balance between capturing valuable aspects and minimising waste at this stage. The focus should be on eliminating waste, which is essential for efficiency. Detailed work is reserved for the design and build phase, ensuring that resources are allocated effectively when needed most.
Figure 14 Areas of the Canvas
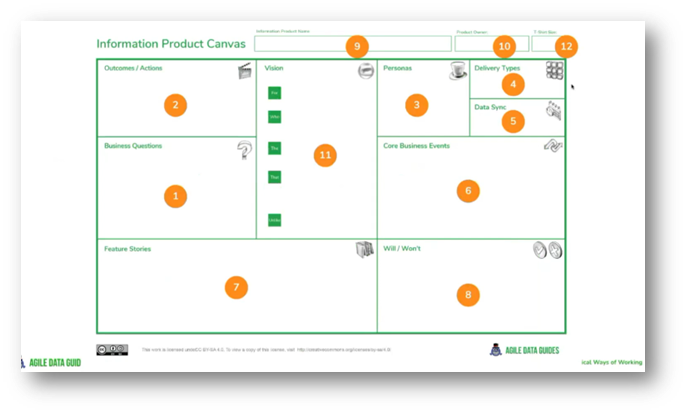
Figure 15 Information Product Canvas Step Count
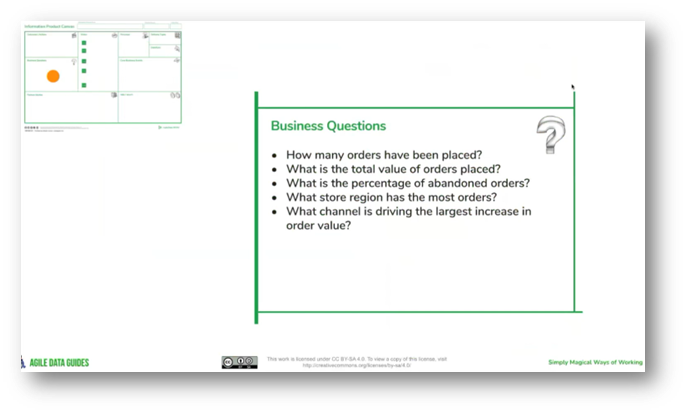
Figure 16 Business Questions
Understanding the Value of Business Information Products
In a prioritisation workshop with stakeholders, the focus is on identifying key business questions and determining the actions that will be taken based on data-driven answers. It is crucial to understand the value of the product by asking stakeholders what actions they would implement if their questions were answered, as this leads to clearer insights.
For instance, if a stakeholder inquires about customers who haven’t placed an order in six months, knowing the response can lead to targeted actions, such as initiating a re-engagement campaign. This approach links business questions to actionable outcomes, thereby facilitating the prioritisation of information products.
The successful outcome of the recent save campaign is expected to include a reduction in churn and an increase in margins; however, stakeholders often struggle to articulate the expected percentage increase in value. Suppose a strong action and outcome statement cannot be elicited during workshops. In that case, it may lead to the conclusion that the product lacks a clear value proposition, making it less competitive against alternatives that demonstrate stronger potential.
Given the significant costs associated with data teams, typically ranging from $100,000 to $200,000 per month, it is crucial to have a clear understanding of a product's value before proceeding with development. Additionally, maintaining an inventory of questions, actions, and answers can help ensure that each product effectively addresses its intended purpose.
The evolving landscape of data management and product development has transitioned from using a basic data catalogue to developing a comprehensive marketplace concept for assets. Currently, there is a trend toward integrating the individual components of products into a contextual framework.
This approach emphasises the importance of contextual information, particularly when employing large language models (LLMs) to analyse decision-making processes and agent behaviour. As a result, there is significant experimentation in this area, with a growing interest in the emerging role of decision scientists focused on understanding the underlying decisions involved.
Shane discussed the importance of understanding business mandates, and the associated actions derived from data analysis. It highlights the potential for multiple data products to support the same decision but lead to different actions, emphasising the need to reduce redundancy, such as creating multiple dashboards without awareness of existing ones.
The context and utilisation of information products are developing, requiring clarity on business questions and the actions that will follow their answers. Additionally, it introduces the concept of persona mapping from product development, which helps identify who will use the data products based on the needs of different customer personas.
To effectively design our products, we should start by identifying key personas such as information consumers and data analysts. Initially, a small number of high-level personas will guide our approach. As we progress, we can refine these into a more detailed catalogue that includes various types of analysts and information consumers, ranging from frontline staff to senior managers and executive officers.
Understanding who will use the product is crucial for tailoring its delivery to meet their specific needs, ensuring usability and value. For instance, if a product is intended for both frontline staff and chief executives, this may prompt further examination, especially in larger organisations, where distinct needs usually call for differentiated solutions.
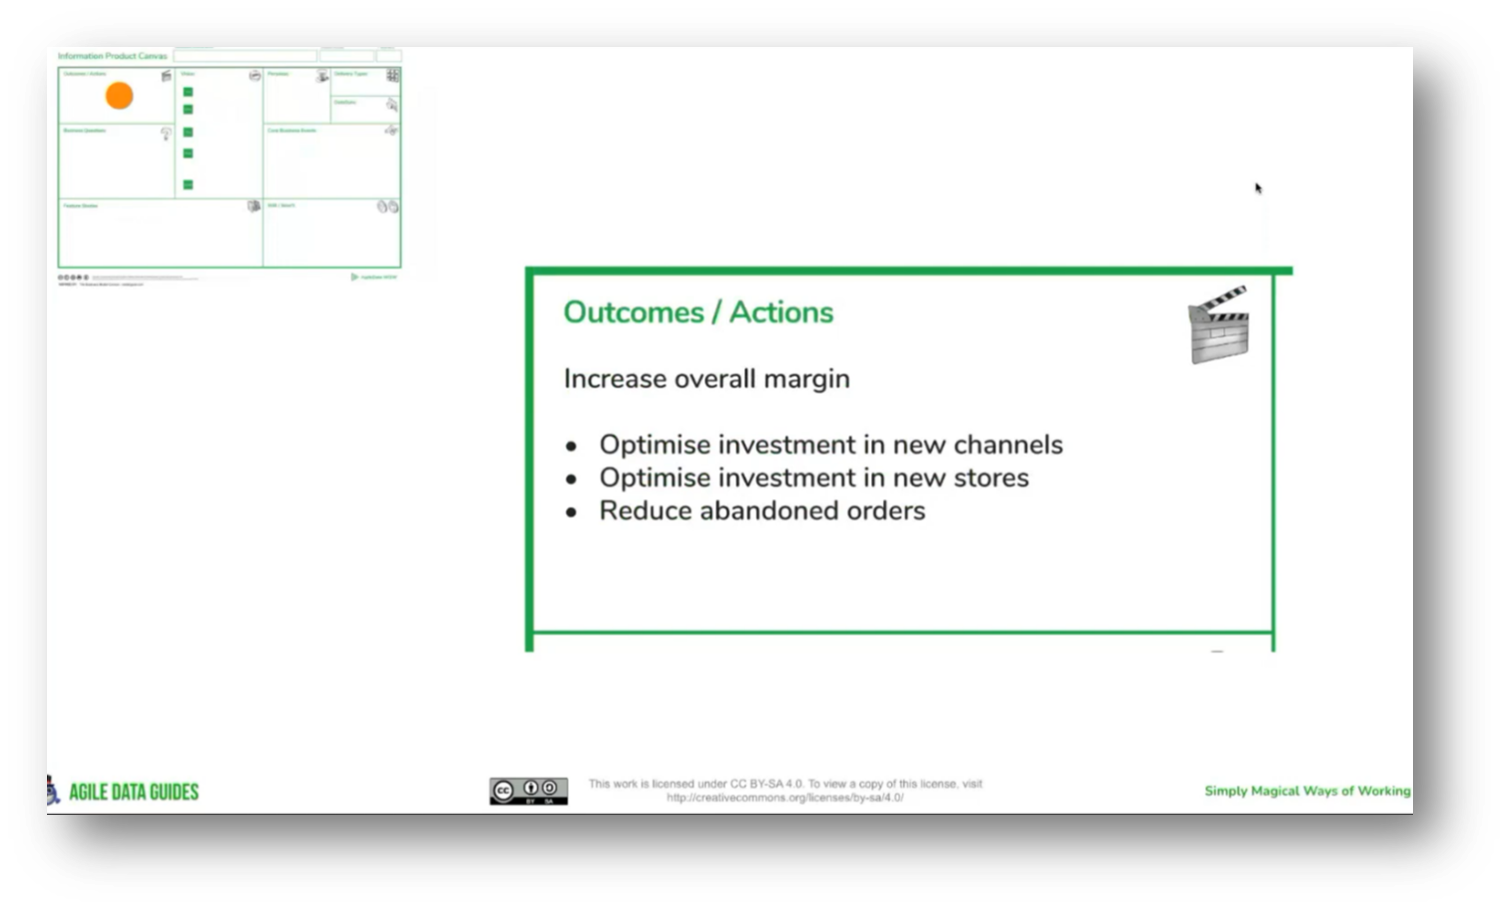
Figure 17 Outcomes / Actions
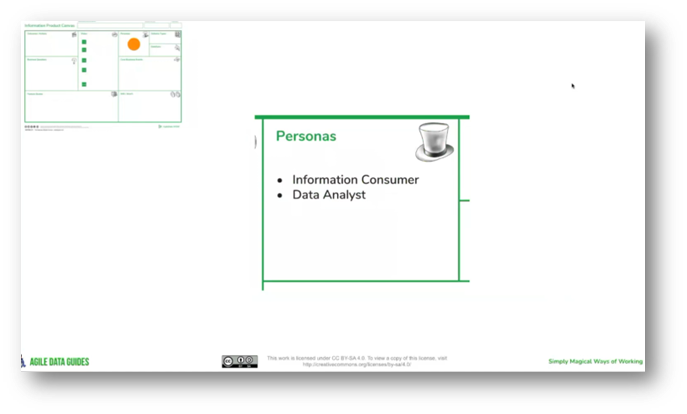
Figure 18 Personas
The Importance of Value-Added Approach and Data-Driven Business Strategy
Shane acknowledged their tardiness and emphasised the importance of understanding the financial value of consulting for companies. He highlighted a common challenge: companies' reluctance to share sensitive financial information with outside consultants. Furthermore, trust is crucial, often established through non-disclosure agreements (NDAs). Shane noted that teams utilising self-consulting strategies can access and analyse pertinent financial data themselves in these scenarios.
In many cases, individuals struggle to quantify business outcomes in terms of specific numbers, such as increased revenue, reduced expenses, or risk mitigation. While articulating actions and outcomes has become relatively straightforward for most people, the challenge of assigning clear and confident numerical values often remains. Consequently, it's rare to see quantifiable metrics represented prominently on planning Canvases.
This limitation is significant, especially as modern business strategies increasingly rely on data-driven decisions, given the shrinking profit margins. Organisations may prioritise actions based on numerical values, highlighting the importance of integrating quantifiable metrics into business strategies to maintain a competitive edge.
Information Delivery Types and their Importance in Business
The importance of identifying the intended users and delivery types for business information products was discussed. Shane emphasised that while dashboards were once the primary delivery type, there's a growing trend towards data services, APIs, and agentic behaviour. Organisations are encouraged to develop a catalogue of delivery types and determine the primary one that stakeholders expect. Additionally, the complexity of a product can be assessed by the number of delivery types required; for instance, if seven delivery types are identified, this indicates a complex product that might benefit from a phased approach to delivery or a re-evaluation of its delivery methods.
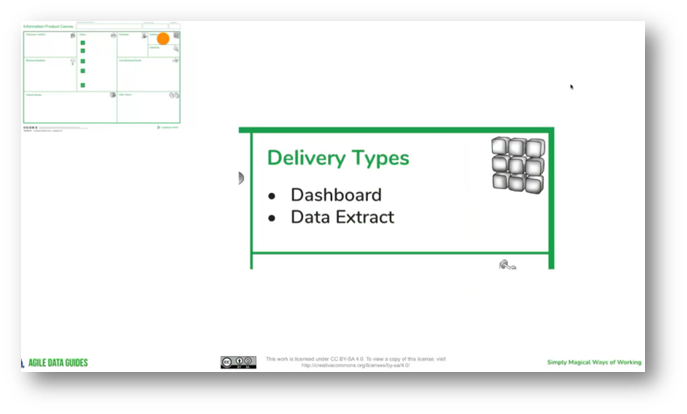
Figure 19 Delivery Types
Data Sync and Service Level Agreement (SLA) Expectations
Shane emphasised the importance of understanding data freshness expectations when establishing a service level agreement (SLA) for information products. While stakeholders often anticipate 24/7 access to data, data professionals must clarify how quickly the data must be updated after inputting records into systems like Salesforce or SAP.
Stakeholders may indicate preferences for data freshness ranging from real-time to daily or even weekly updates, with specific timeframes often specified—for instance, needing data refreshed by 6 AM before work. This focus on data freshness is vital, as it influences the complexity and engineering requirements needed to meet these expectations based on the source systems involved.
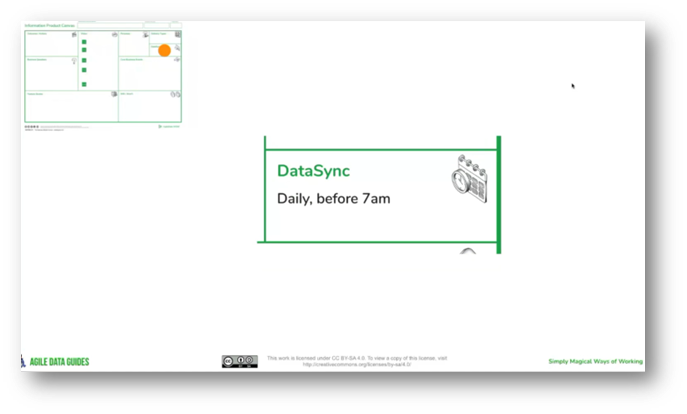
Figure 20 DataSync
Understanding the Process of Data Management and Event Analysis
The focus of our analysis is on identifying core business events that drive data capture, positioning ourselves on the right side of the Canvas, which emphasises data and data teams. We aim to avoid excessive detail at this stage, steering clear of in-depth technical specifications, such as solar systems or specific tables and attributes.
Instead, Shane added that he was guided by Lawrence Core's framework, which emphasises understanding the key events that lead to data generation. High-level processes, such as customer order placement, payment confirmation, and product shipping, are our initial focus. While we may encounter some system names relevant to these events, such as Tread 3 for order creation, our goal is to recognise and document these events for later exploration and discovery.
The process begins with understanding the data source and its characteristics, which guides us to explore feature stories. These feature stories include two types: product feature stories, such as the ability to drill down from a dashboard into detailed records and export data to Excel, and data stories that address specific business questions like the number of orders placed by month and store.
Instead of placing these queries in a question box, it's now more efficient to categorise them as variables and filters within a data story framework. This approach allows for a comprehensive view, enabling an information consumer to analyse related metrics, such as payments and shipments, alongside orders by store and month.
In Agile and Scrum practices, user stories typically follow the structure of "as a persona, I want," omitting the "so that" clause, as the outcome is directly tied to the product's actions. Teams often generate three to five of these user stories before progressing to scope expectations in subsequent discussions. In the scope section, any requests that may be uncertain are documented as "will" (with a note indicating they require further exploration), while confirmed achievable requests are also marked as "will" to track commitments. Conversely, any agreed-upon elements outside the current scope are recorded as "won't," clarifying expectations to stakeholders who may assume all discussions fall within the project scope. This approach ensures alignment and transparency in project priorities.
In the process of analysing data from Canvases, individuals tend to focus on the white spaces first, leading to an assumption that all other elements represent completed information. Shane noted that progression through the delivery stage of the information value stream necessitates this dynamic, which evolves, requiring ongoing validation of data.
While it may have been straightforward to supplement information from the past two years, retrieving historical data before the migration from NetSuite to Salesforce presents challenges, as much of it is archived and not directly accessible. Consequently, stakeholders will face the decision of how to proceed with obtaining the necessary five years' worth of data, recognising the additional effort involved.
The choice between a quick delivery of a product with two years' worth of data and a delayed release incorporating five years of data involves a trade-off between speed and value. It's important to note that the organisation's feature stories can be presented in various ways; bullet points, for instance, are an alternative to traditional narrative formats. Additionally, in writing, clarity is key, and it's recommended to position critical information, such as "wills" and "wants," at the beginning of sentences to enhance readability, as this aids in quickly identifying whether the content is within or out of scope. A recent experience with a coaching team highlighted the confusion that can arise when these elements are placed in the middle of sentences.
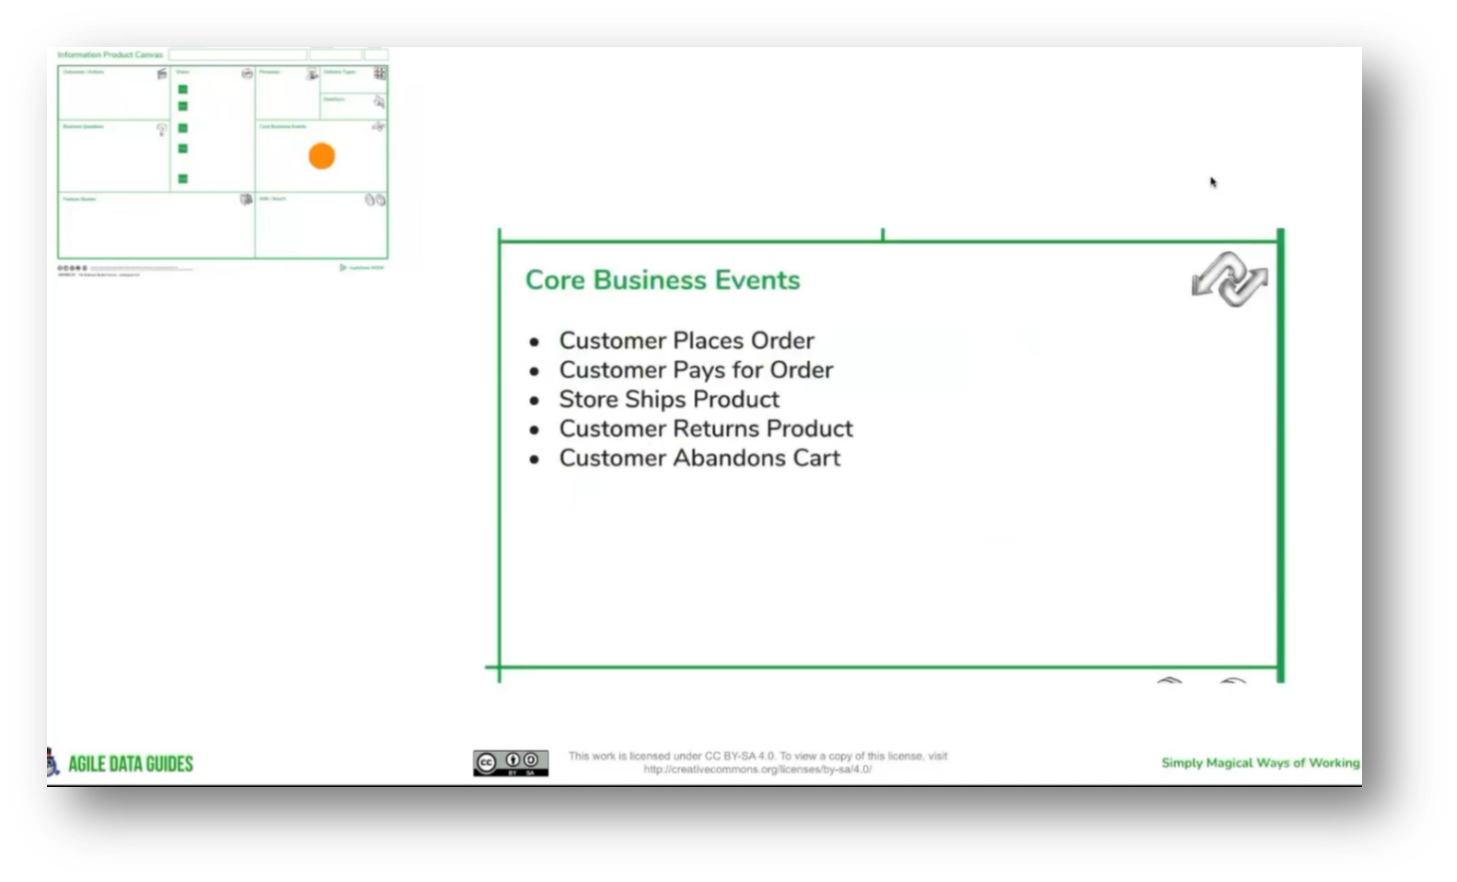
Figure 21 Core Business Events
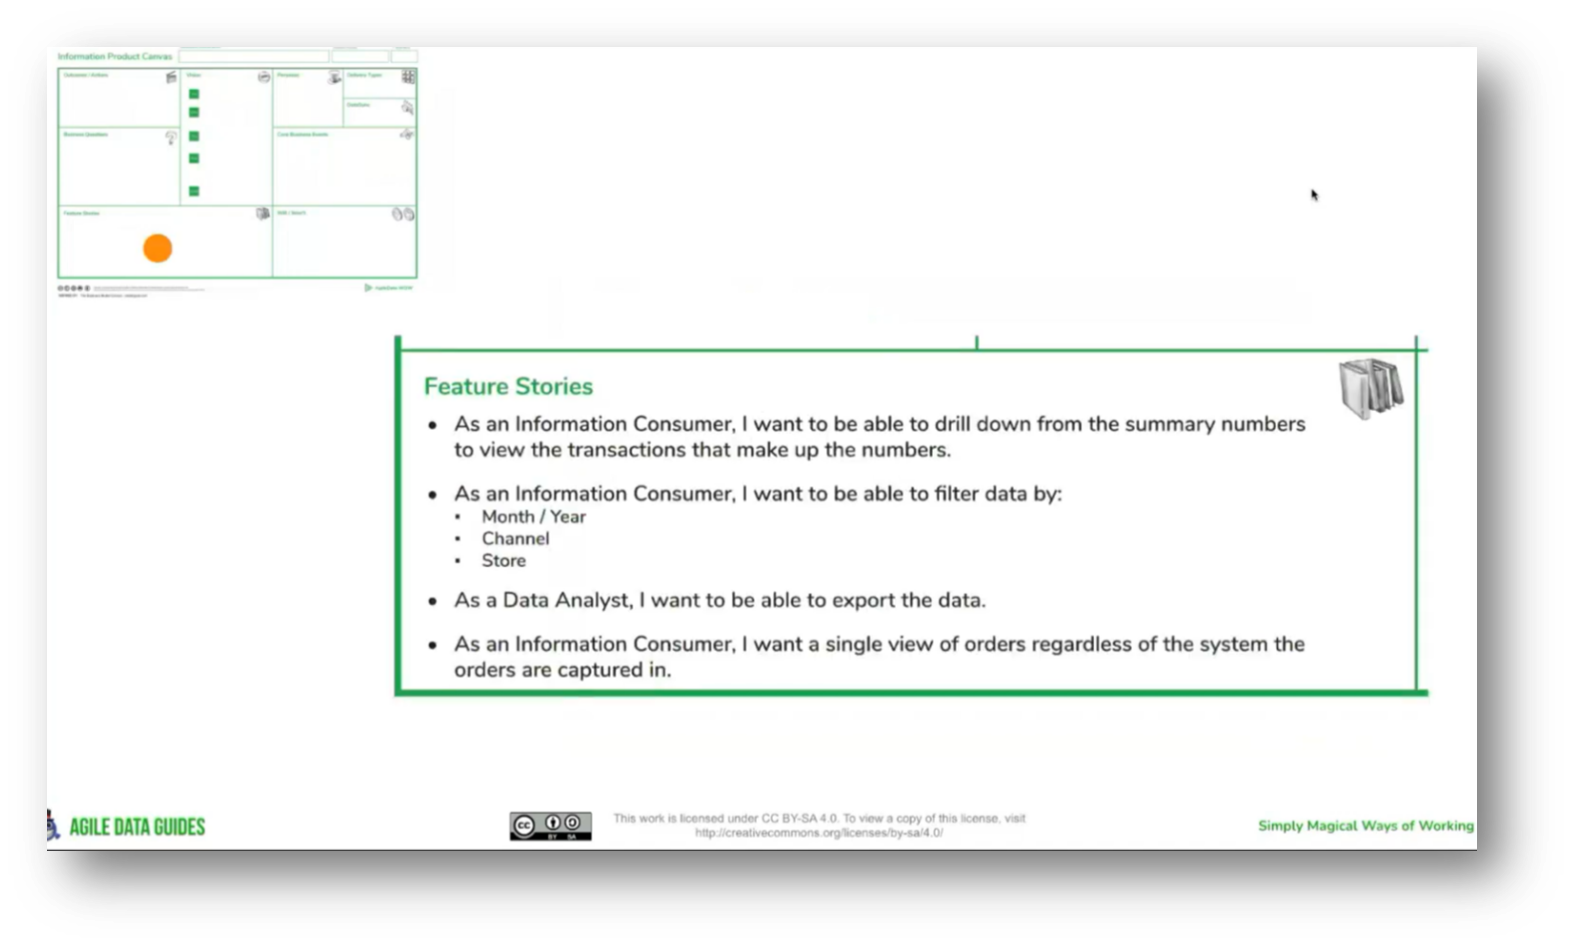
Figure 22 Feature Stories
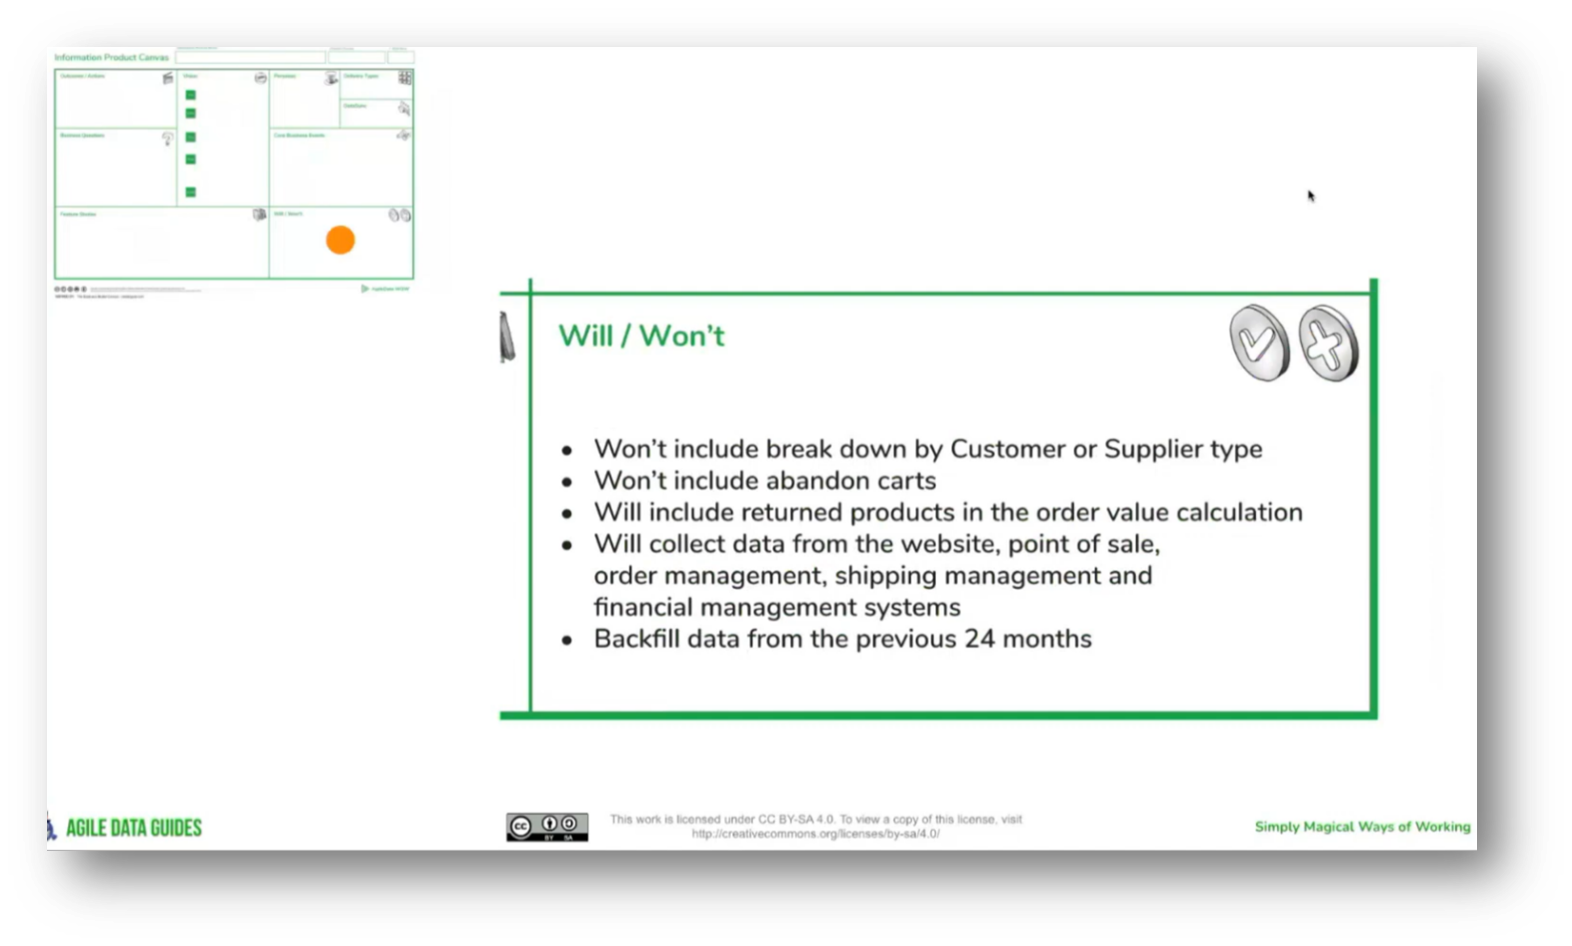
Figure 23 Will / Won't
The Process of Product Creation in Business
To effectively address business questions, key actions and outcomes must be identified, including understanding the intended users and their specific data needs, the frequency of data refresh, and the data sources from which the data is obtained. It's essential to clarify the desired features—whether data-oriented or product-oriented—while also establishing what is within and out of scope.
Once these elements are defined, a product name should be assigned that reflects the organisation's culture, whether it be contextual, numerical, or unconventional. This name will help differentiate various products, such as those related to order revenue metrics. Finally, if utilising Scrum or a similar framework, identifying the product owner or manager who will collaborate with the data team on trade-off decisions is crucial for the product's development stage.
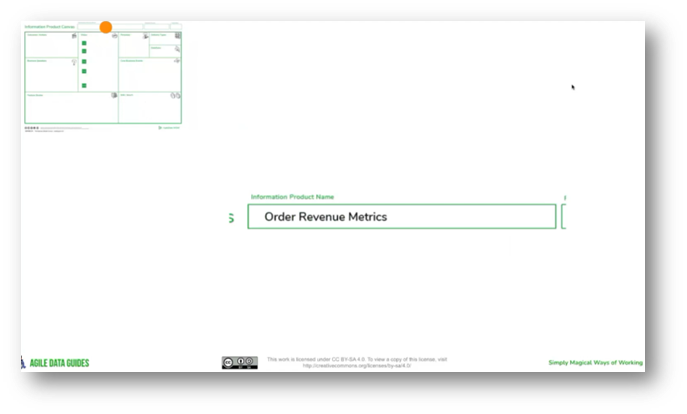
Figure 24 Information Product Name
Product Development Strategy and Stakeholder Engagement
In developing a vision statement for a product, the framework inspired by Jeffrey Moore's "Crossing the Chasm" is utilised to articulate a concise value proposition for stakeholders. This approach simulates a scenario where a salesperson has just two minutes to explain the benefits of their product, focusing on the business impact, desired actions, and outcomes.
The vision box and actions/outcome box are crucial for prioritisation in product development; however, the necessity for stakeholders to assess value and cost has led to the inclusion of a final component: T-shirt sizing, which quantifies the resource requirements for each potential product.
Estimating the size of a project can be challenging, as humans generally struggle with accurate estimations. A common practice is to use a T-shirt sizing approach, categorising projects into sizes from extra small to oversized, where each size is associated with a rough time frame (e.g., extra small for one week, up to oversized for over a year).
This method enables teams to make relative comparisons without requiring precise estimations, which can often lead to inefficiencies. Most data teams, to ensure timely delivery, typically avoid bringing projects larger than a certain size into the design phase, opting instead to break down larger projects into smaller components for iterative development and early value delivery. This approach serves as a useful marker for understanding the scale of a project.
Shane then focused on utilising toolboxes for stakeholder engagement, emphasising the importance of a 30 to 40-minute interaction to extract insights related to business needs. This approach mirrors practices in use case ideation, aiming to align product delivery with stakeholder requirements.
Each toolbox serves as a constraint model, drawing on years of experience in product and data domains to capture essential information efficiently. Adapting the format to include use case language is encouraged to enhance relevance. Ultimately, these strategies should converge on a set of use cases, highlighting the critical role of ideation in achieving strategic objectives.
In a recent discussion about documenting use cases, Shane noted a need to identify and include a section for related products to ensure that all relevant stakeholders are considered during meetings. This addition would help in determining which fringe stakeholders may be impacted. It was suggested that the related products could be incorporated into the "Business Questions" or the "Core Business Events" sections, as the latter typically offers more space for content. However, this approach presents a challenge, as not all products may have direct relationships, necessitating a review and iteration of the documentation to ensure accuracy.
When collaborating on projects, stakeholders often take notes in different formats, whether on paper or electronically, sometimes using the back of a document or a Canvas to track information. Cataloguing Canvases can facilitate the creation of related product linkages, which is important for understanding product relationships.
A key question to consider is whether stakeholders care about these relationships while articulating their needs. This inquiry can reveal the underlying social dynamics among stakeholders, which can significantly impact project progress and outcomes.
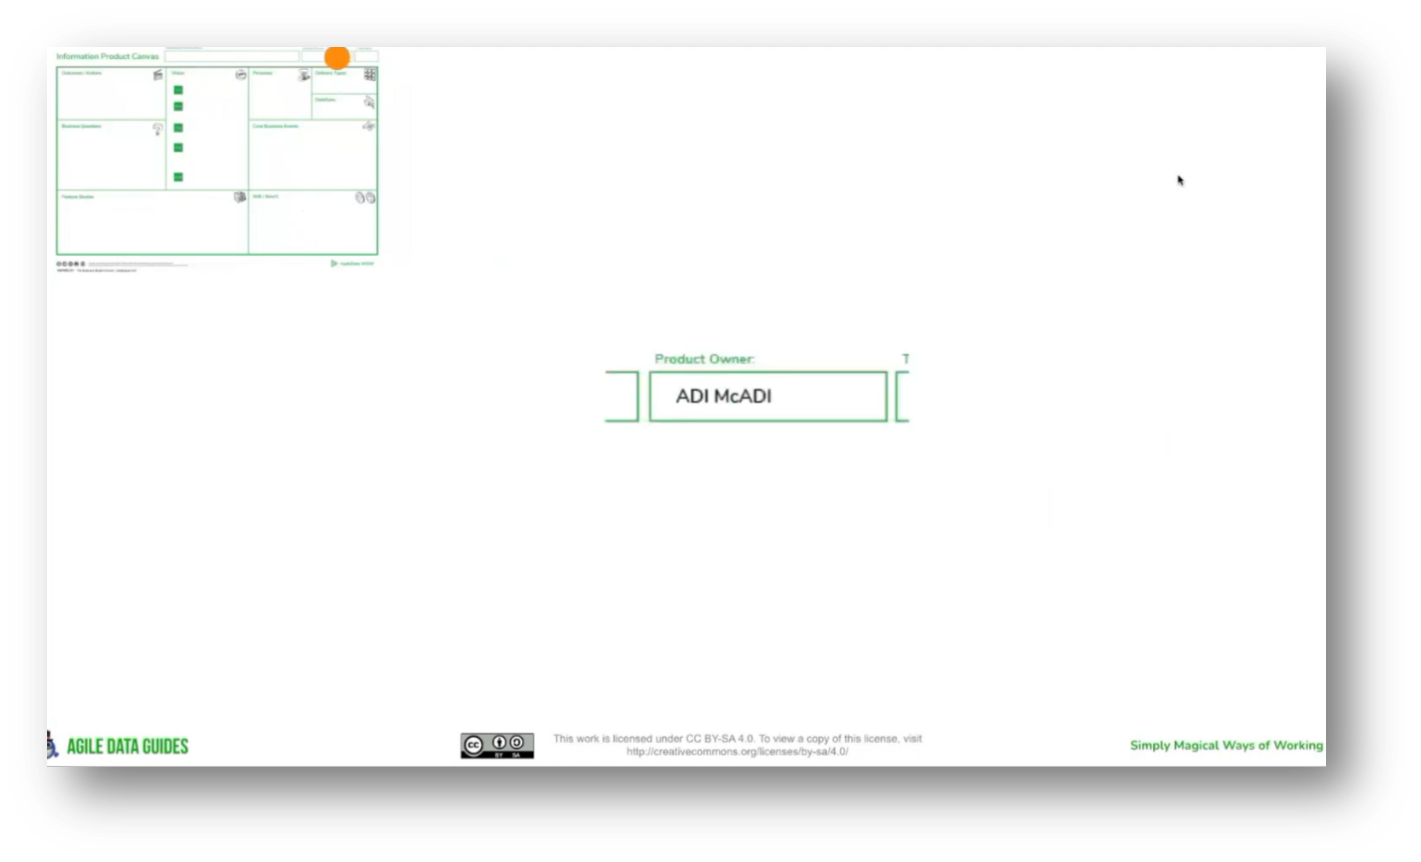
Figure 25 Product Owner
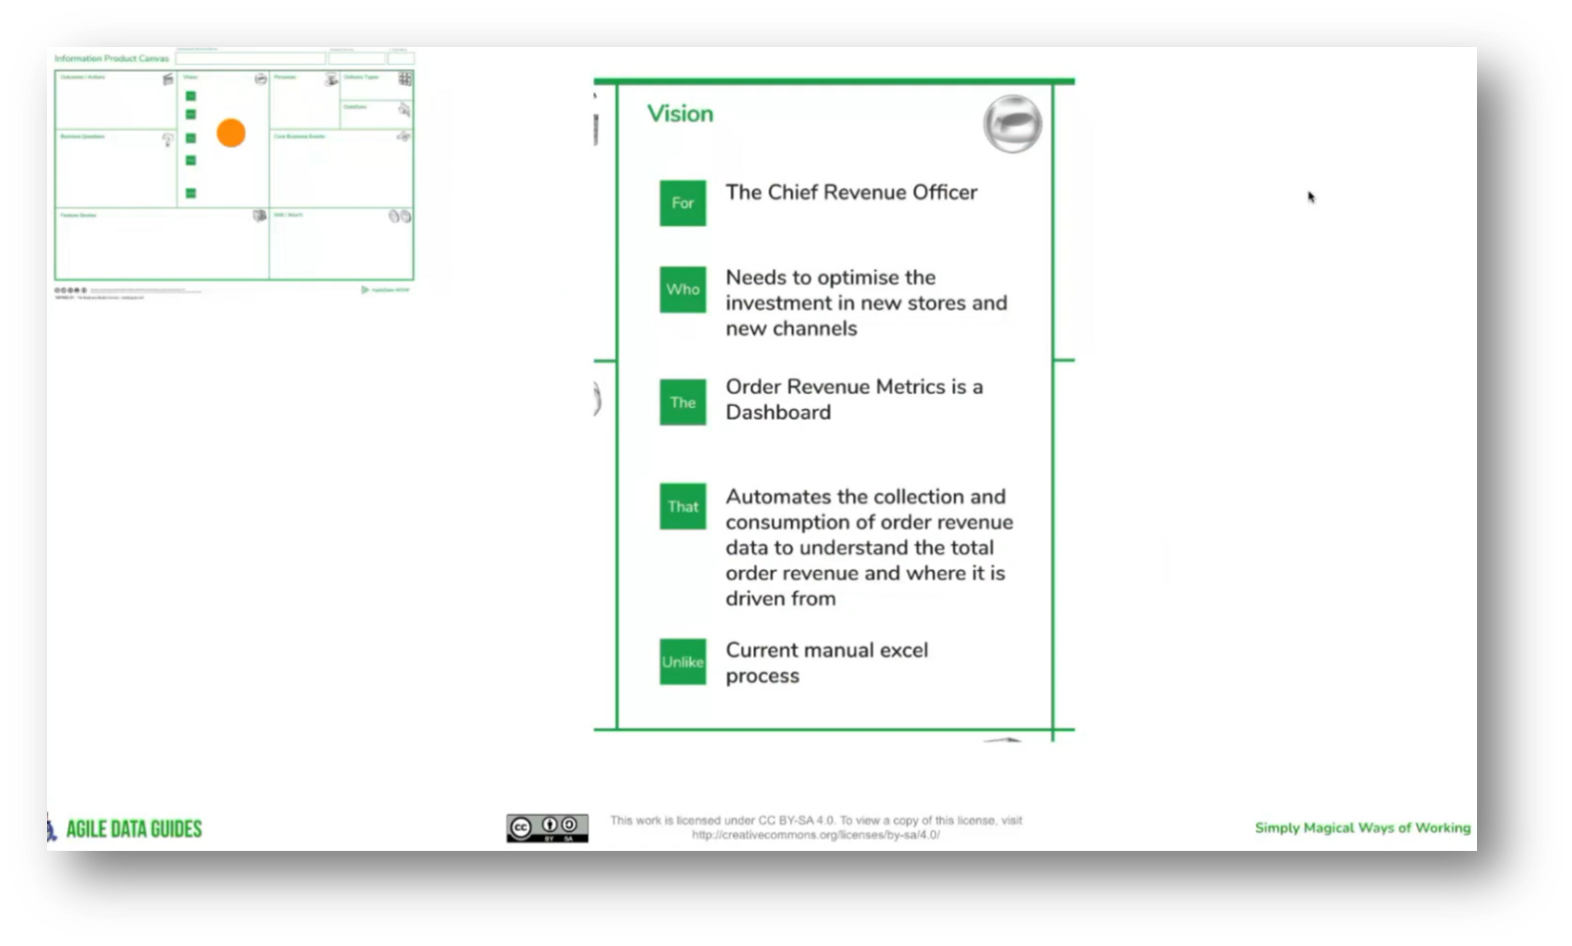
Figure 26 Vision
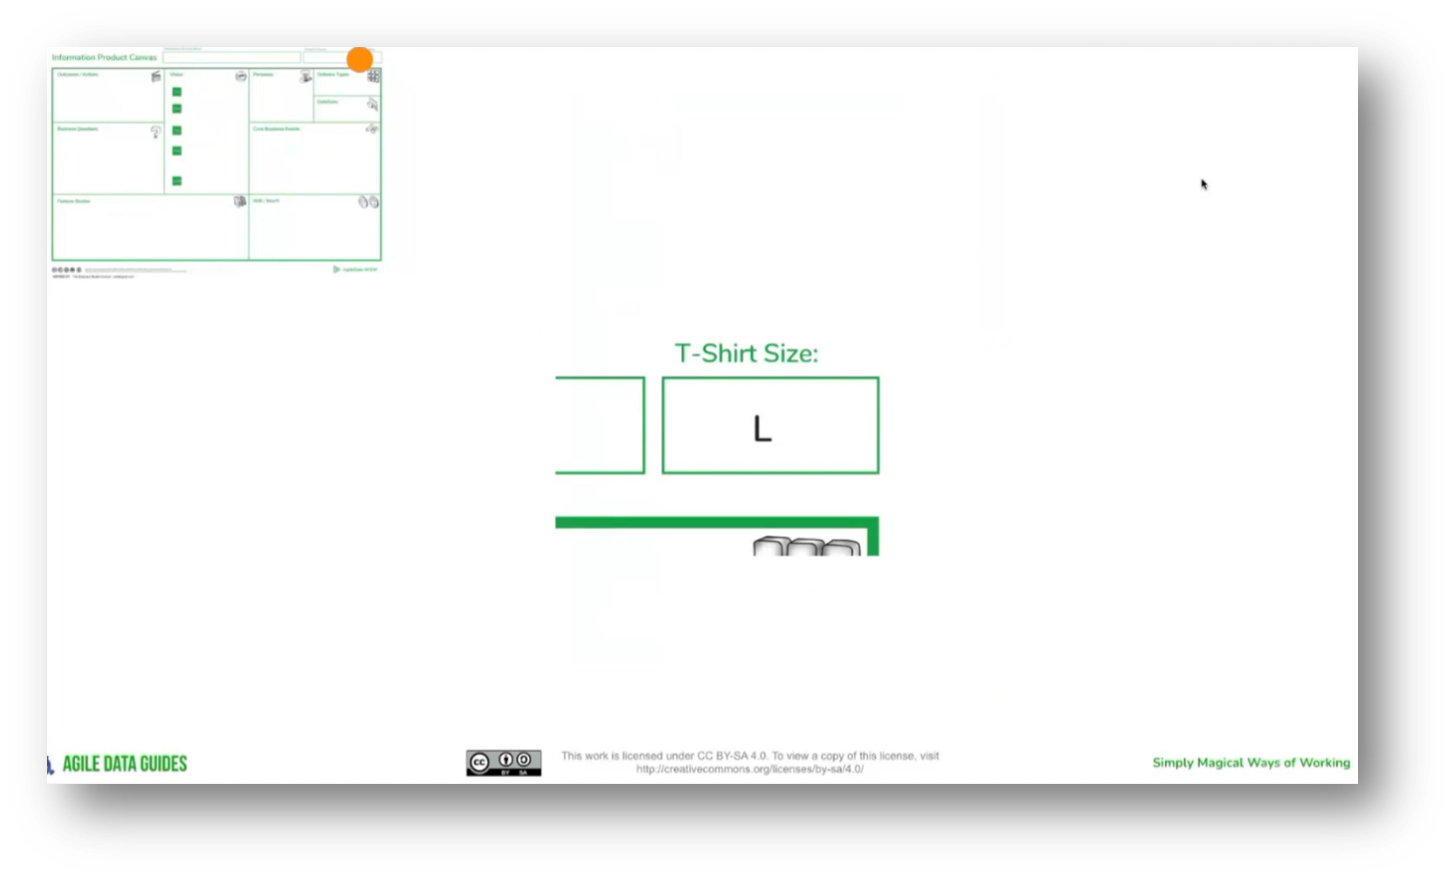
Figure 27 "T-Shirt Size"
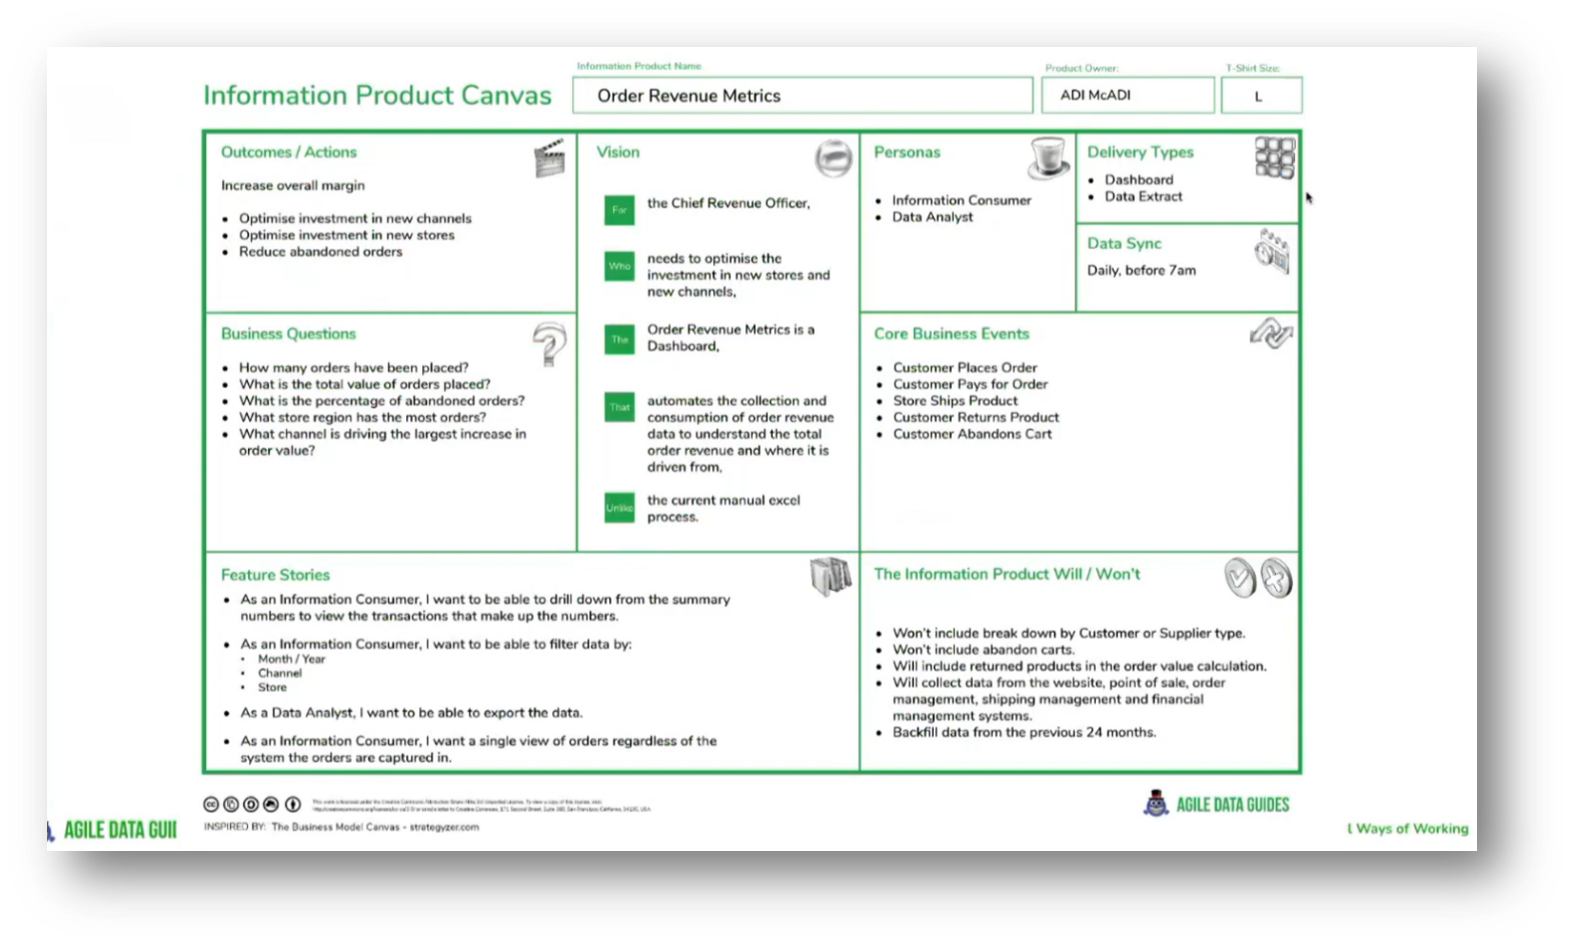
Figure 28 Completed Information Product Canvas
The Responsibilities of T-shirt Sizing in Project Development
The process of T-shirt sizing for project tasks is typically managed by the data team rather than stakeholders, as their expertise allows for more accurate estimations of the effort required. This sizing often occurs after the initial Canvas is completed, allowing the data team to retrofit the T-shirt sizes before prioritisation.
The challenge with T-shirt sizing can arise when certain stakeholders exert pressure to include their work, potentially skewing the process. Overall, leveraging the data team's insights ensures a more reliable assessment of the workload involved.
Shane drew an analogy to a plumber fitting a dishwasher, highlighting the importance of professional expertise in estimating time for tasks. He pointed out that stakeholders, not being data professionals, often manipulate project timelines to align with their objectives, which is understandable given their goal of problem-solving. Lastly, Shane reflected on the dynamics between technical expertise and stakeholder expectations in project management.
The Complexity of Feature Stories in Agile Development
When creating feature stories in an agile environment, it's essential to determine the appropriate level of detail before development begins. These stories can be either high-level or more atomic, with the expectation that further breakdown will occur during the actual work process.
It's essential to note that constraints, such as font size and box dimensions for displaying information, limit the amount that can be written. Typically, stakeholders will provide 5 to 8 key user stories that highlight their main priorities, which will guide the development process without overwhelming the team with excessive detail upfront.
The design phase involves revisiting initial discovery requirements to extract key high-level feature stories, which are essential for understanding the project’s direction. This process is constrained to a half-hour Canvas session aimed at identifying what is most important without delving into detailed requirements.
Once the foundational features are approved, teams are encouraged to flesh out more comprehensive user stories, as this step is crucial for outlining the project's specific tasks. It's important to note that different teams may have varying approaches to documenting these detailed user stories.
Data Quality and Source Systems in Business Processes
The importance of incorporating source systems, such as aligned data products and data quality assessments, into the data management process was emphasised. Shane emphasised that while notes on source systems can be integrated into the core business events area, the responsibility for determining data sources lies with data professionals.
Shane then asserted that data quality is a fundamental responsibility of these professionals, likening it to a chef refusing to cook with spoiled ingredients. Lastly, he argued that, just as a restaurant must advocate for high-quality supplies, data teams must ensure the quality of their data throughout their work without needing a dedicated data quality box in their framework, as this should be inherently addressed in their processes.
And if the data quality coming in is a problem, we will work with our stakeholders to identify where the poor data is coming from and ask them to rectify it.
Shane highlighted the importance of understanding stakeholders' comfort levels with current data quality issues before developing products. By engaging stakeholders, the team was able to prioritise data quality cleanup, which ultimately prevented product failures due to poor data quality.
This proactive approach allowed the team to align their efforts with stakeholder experiences, ensuring that the product was designed for greater success. Additionally, Shane emphasised the need for stakeholders to meaningfully express what they deemed important in relation to data quality and its impact on their work.
Shane focused on the importance of ensuring data quality in the order management process. He began by assessing the number of orders placed and evaluating the reliability of the provided information, which was often characterised as inadequate. The focus is on addressing quality issues before going live with any systems, emphasising that stakeholders must prioritise functionality over the mere existence of features.
Through parallel efforts to improve data quality, the initiative successfully advanced product deliveries while driving significant improvements in data integrity. Additionally, it points out the challenge of tracking specific events, such as abandoned carts, due to limitations in data streaming from the e-commerce platform.
Stakeholders are faced with a decision regarding how to handle abandoned cart data, which requires significant changes in the SAW system for accurate tracking. The data quality in key business processes, such as order placement, payment, and shipment, is consistent; however, there are significant issues with returns data.
Lastly, stakeholders must decide whether they prefer partial information derived from low-quality data or to forego responses altogether. There is a growing trend within data teams to analyse product behaviour, allowing for better correlation of event quality with business performance.
The quality of data plays a crucial role in addressing business questions and has a significant impact on outcomes. Low-quality data can lead to complications when reporting to regulatory bodies, as providing inaccurate information poses risks. In the context of a marketing email campaign, understanding the quality of data helps assess the level of risk associated with actions taken. Furthermore, engaging related stakeholders, particularly those upstream in the data process, can foster collaboration to improve data quality and synchronisation in business processes, ultimately leading to more informed decision-making and reduced risks.
Product Development and Business Questions
The importance of recognising that no single Canvas or methodology governs all situations was emphasised, as various books and templates being released currently offer different perspectives that can complement one another. Shane shared that this collaborative approach to understanding methodologies was highlighted as essential.
The process of creating an effective information value stream involves integrating various methodologies, such as John Joel's town planning principles and agile user stories from Scrum. It's important to recognise that no single approach is exclusive; rather, a combination of effective practices can be tailored to suit the unique needs of teams and organisations.
This template allows for flexibility, enabling users to modify elements such as colours, boxes, and text to better align with their requirements and ensure that stakeholders can clearly understand the captured information. Ultimately, the goal is to develop a collaborative workflow that enhances clarity and communication within projects.
Shane highlighted the importance of formulating effective business questions in a constrained format. It suggests that while one could propose numerous inquiries, it's beneficial to focus on high-level questions such as trends in orders or valuations per location. To guide stakeholders, it emphasises using structured prompts, such as "how many," "how much," and "how long," encouraging them to think critically about their requirements.
Often, stakeholders may initially provide just a few questions before overwhelming the discussion with numerous additional ones, reflecting a mindset shaped by previous experiences of limited opportunities for input. This emphasises the need for clearer methodologies in eliciting comprehensive requirements for product development.
The importance of iterative collaboration in project development was highlighted, suggesting that initial efforts should focus on building trust by delivering small, valuable components before potentially expanding work for other stakeholders. Shane then highlighted the need for organisational decision-making to prioritise the most valuable tasks while cautioning against scope creep, where detailed questions may arise prematurely. Lastly, the language used in project documentation, such as terms related to forecasting and predictive modelling, serves as an indicator of a product's complexity and can provide a quick assessment of its size and intricacy without relying solely on standard sizing methods.
If you would like to join the discussion, please visit our community platform, the Data Professional Expedition.
Additionally, if you would like to be a guest speaker on a future webinar, kindly contact Debbie (social@modelwaresystems.com)
Don’t forget to join our exciting LinkedIn and Meetup data communities not to miss out!