
Data Warehousing, BI, Big Data & Data Science for Data Management Professionals

Executive Summary
This webinar highlights the critical roles that data professionals play in Business Intelligence (BI) and Big Data analysis. It emphasises the importance of optimising analytical techniques and fostering a data-driven organisational culture. Howard Diesel addresses the significance of Data Warehousing and its integration with AI for effective business decision support while examining the evolving landscape of Data Management and its impact on innovation.
Additionally, the webinar explores the relationship between statistical modelling and machine learning, focusing on the deployment, monitoring, and management of machine learning models. By understanding Data Governance, the implications of synthetic data, and the relevance of Ontology in data mapping, organisations can enhance their analytical capabilities in various sectors, including healthcare and smart cities.
Webinar Details
Title: Data Warehousing, BI, Big Data and Data Science for Data Citizens
URL: https://youtu.be/2cKe4p_uQpI
Date: 05 December 2024
Presenter: Howard Diesel
Meetup Group: African Data Management Community
Write-up Author: Howard Diesel
Contents
Data Professionals in Business Intelligence and Big Data Analysis
Role of Analytics in Business Intelligence
Optimising Data Analysis Techniques
Addressing Data-Disability in Organisational Culture
The Transition to Data-Driven Thinking
Understanding Data Warehousing and Big Data
Data Warehousing and AI in Business Decision Support
Common Aspects of Data Management and Business Innovation
Understanding the Differences of Data Warehousing and Big Data
The BI Process and its Importance in Business Performance Measurement
Evolution and Impact of Data Warehouse Models
Understanding the Dynamics of Data Warehousing and Integration
Data Science and AI
The Implications of Synthetic Data in Machine Learning
Data Sources and Data Governance in Business
Statistical Models and Data Integration in Data Analysis
The Intersection of Statistical Modelling and Machine Learning
Monitoring Machine Learning Models in Data Management
Data Deployment and Monitoring in Data Warehousing and Machine Learning
The Importance of Ontology in Data Mapping and Integration
Data Management and Analysis in Healthcare and Smart Cities
Managing Machine Learning Models in Changing Data Scenarios
Feature and Dimension Reduction in Model Building
Data Professionals in Business Intelligence and Big Data Analysis
Howard Diesel opens the webinar stating that this instalment is part of a Data Warehousing, BI, and Big Data training course. Moreover, Howard shares that the focus is on the role of Business Intelligence and Big Data in providing insights for decision-making. The webinar will discuss the evolution of Data Science, referencing it as the "4th paradigm of science," which utilises data for hypothesis development and validation.
The webinar will use the example of the integration of astronomical data from global observatories to enhance understanding and the introduction of a data citizen approach. Again, Howard notes that the focus is on the roles of data professionals, such as BI developers, data engineers, and machine learning engineers.
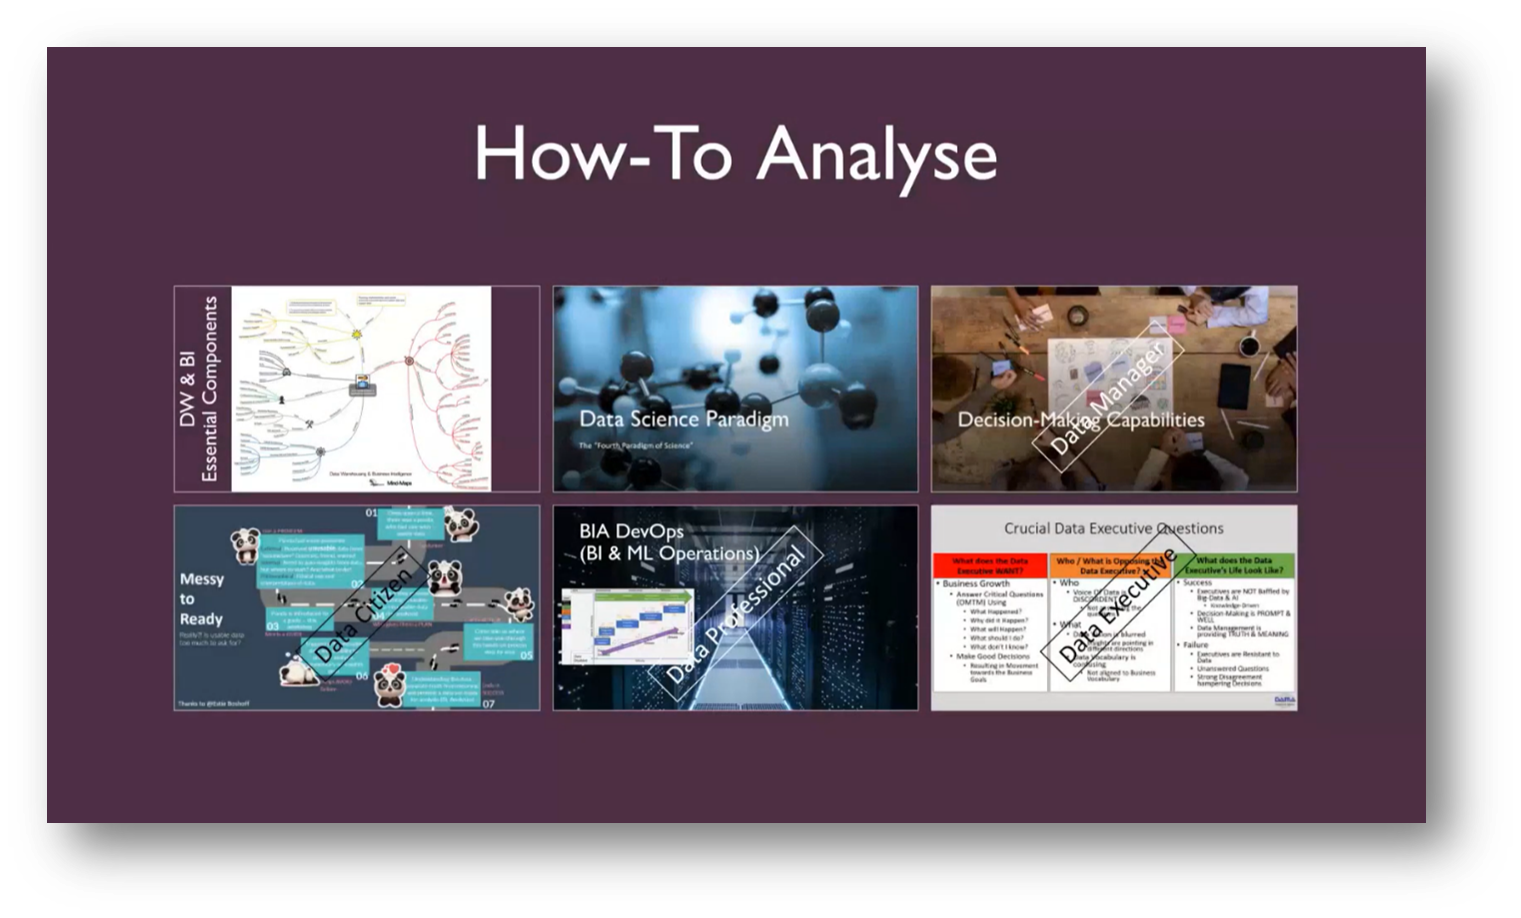
Figure 1 How-To Analyse
Role of Analytics in Business Intelligence
The focus is on the concept of analytical maturity. Howard highlights the various types of analytical methods utilised in Business Intelligence (BI). He then distinguishes between descriptive analytics, which provides insights into past events, and diagnostic analytics, which answers questions about what happened and why. This foundational understanding supports the transition to predictive analytics, which aims to forecast future outcomes based on previous data trends, such as budget performance. Key techniques in predictive analytics include statistical analysis, predictive modelling, and multivariable statistics, all of which help organisations anticipate future scenarios and make informed decisions.
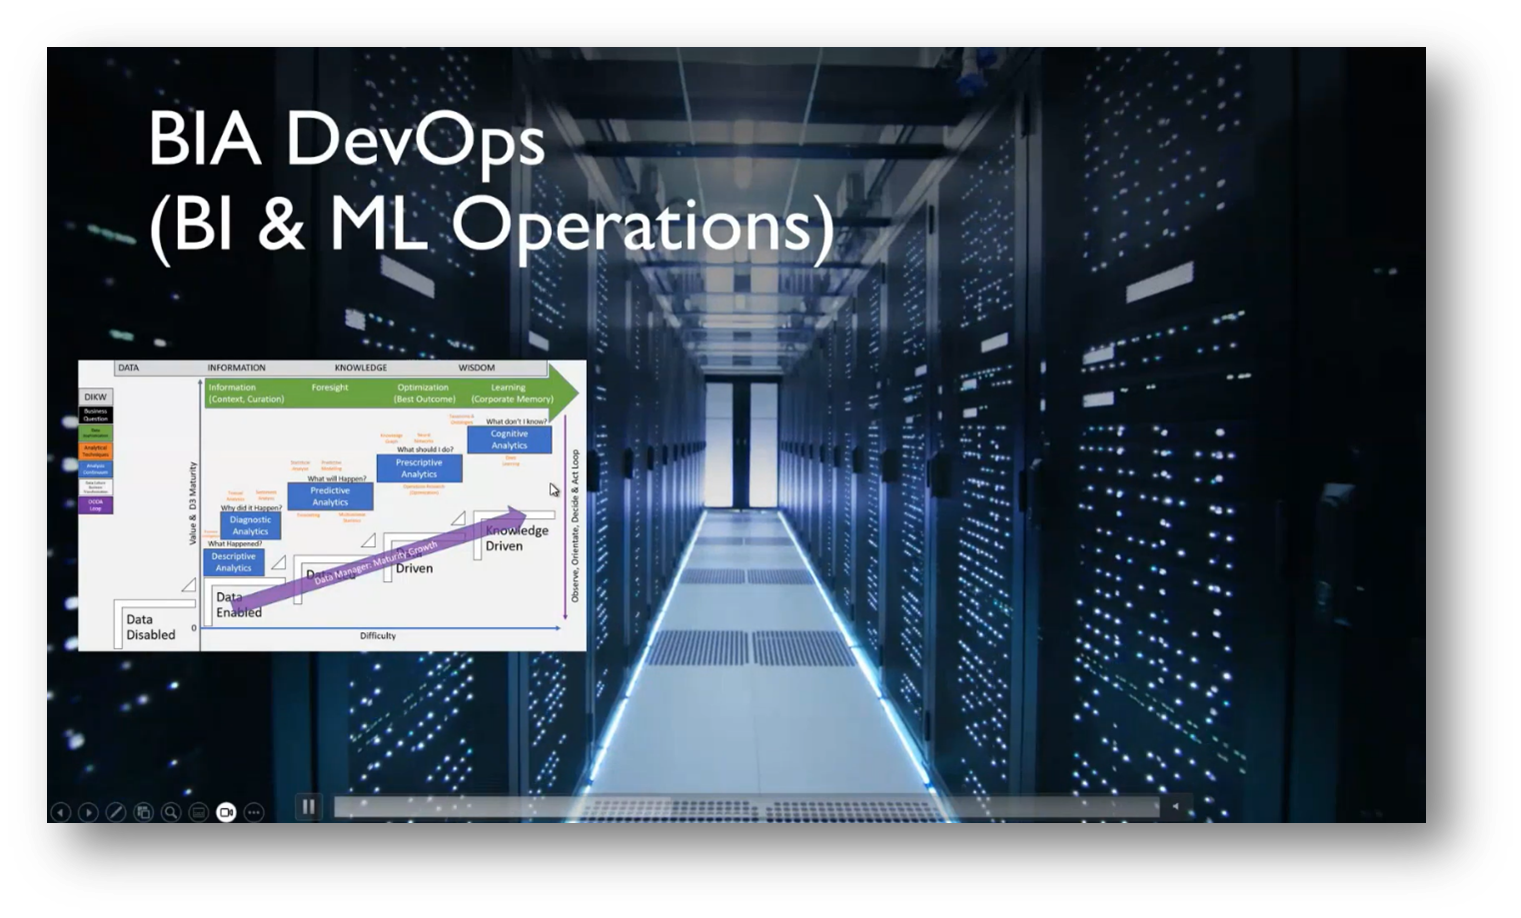
Figure 2 BIA DevOps
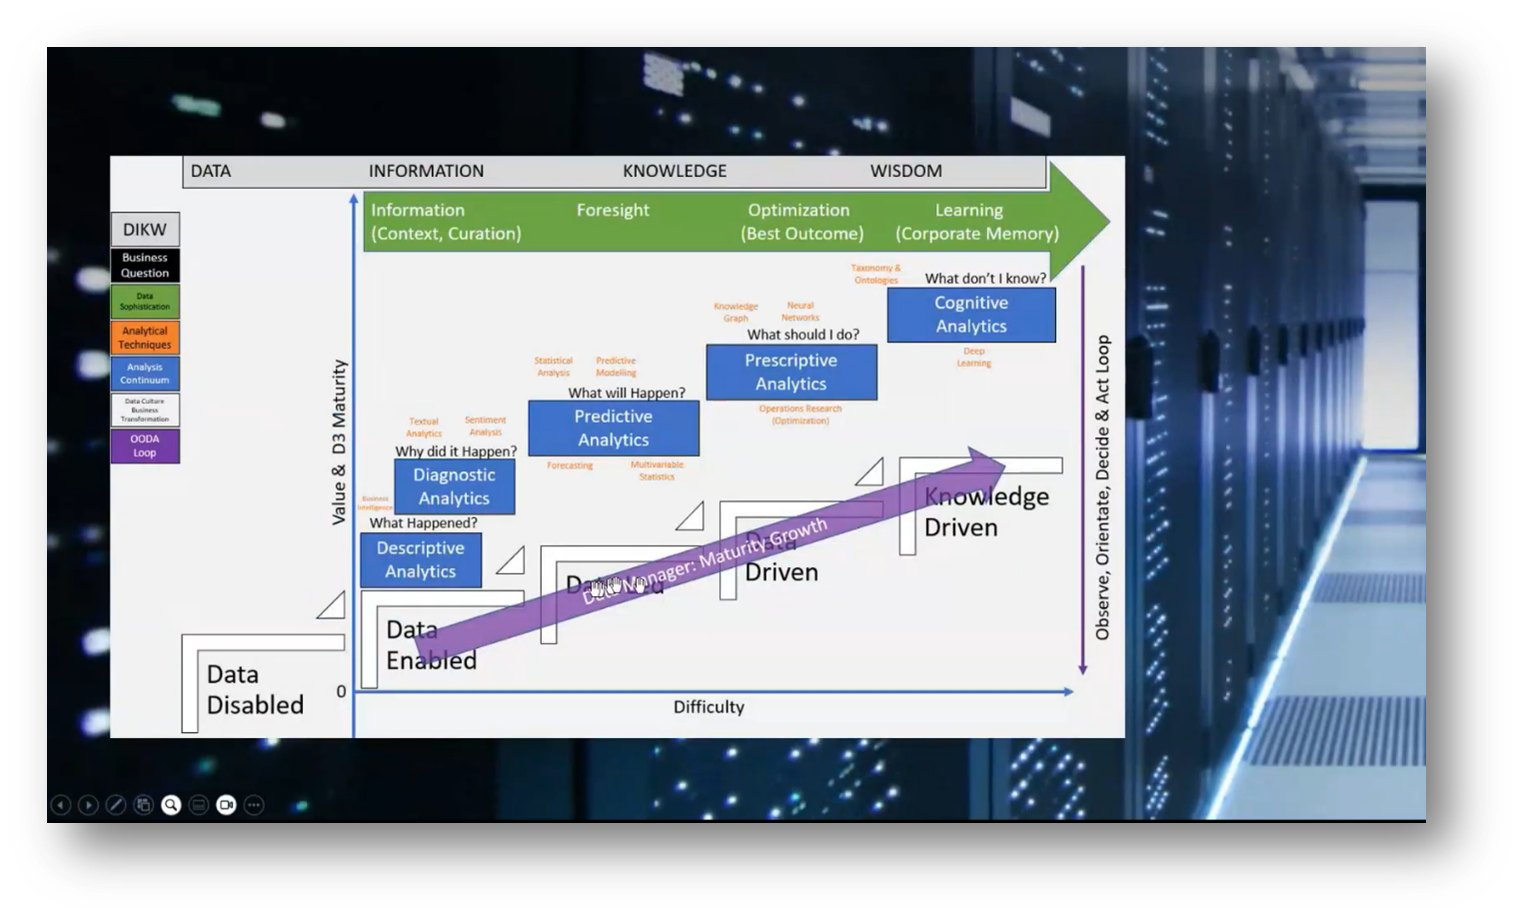
Figure 3 Data Management Maturity Growth Diagram
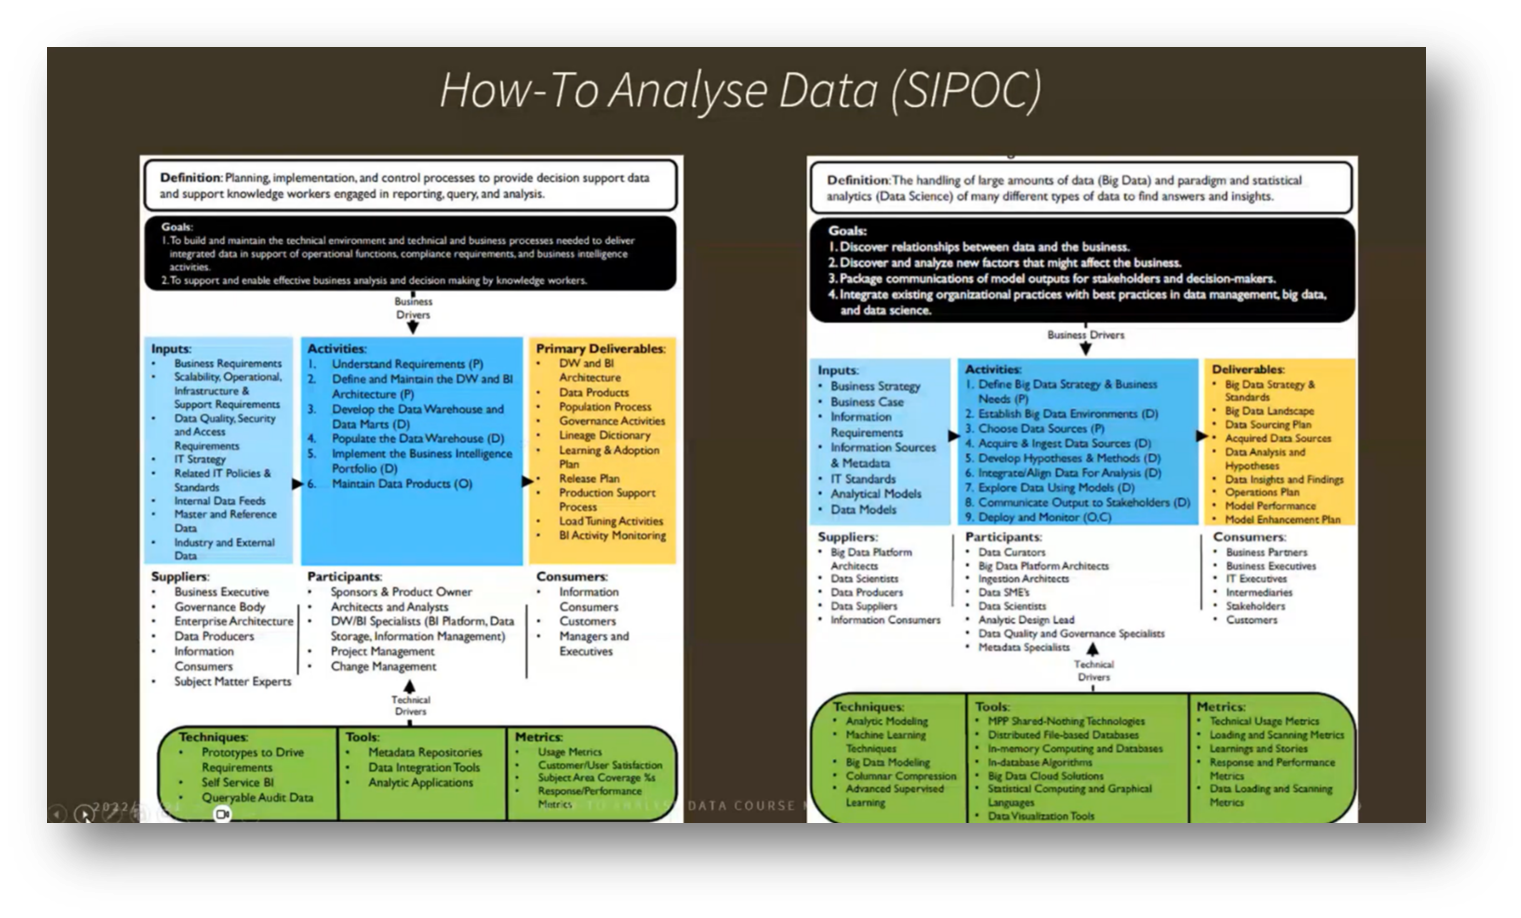
Figure 4 How-To Analyse Data (SIPOC)
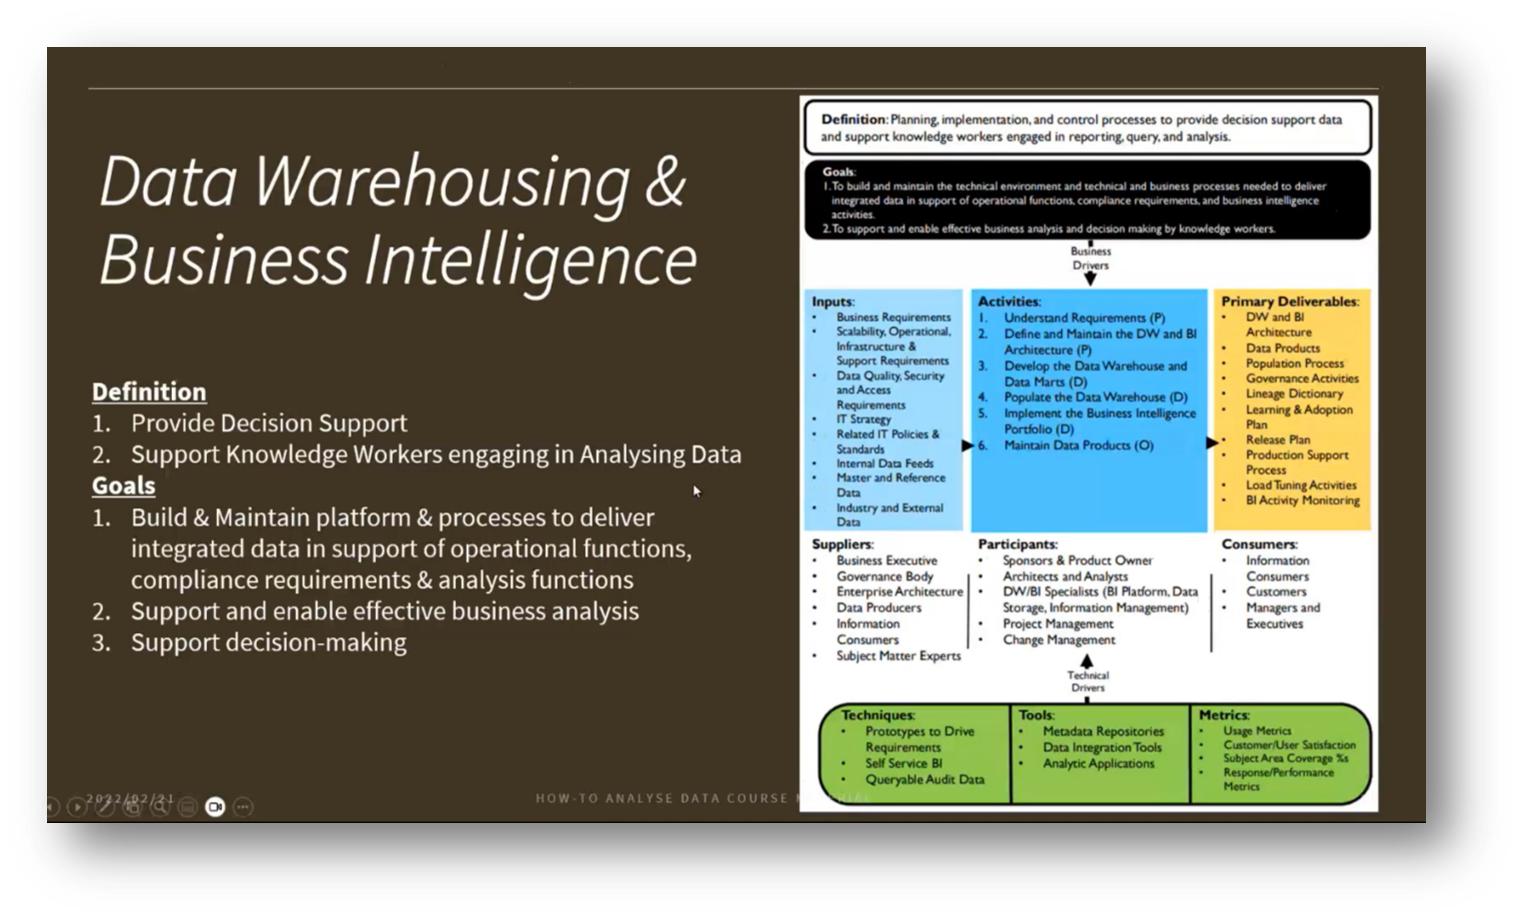
Figure 5 Data Warehousing & Business Intelligence
Optimising Data Analysis Techniques
Howard highlights the significance of understanding outcomes and optimising them through operations research, which is a key aspect of prescriptive analytics that answers the question, "What should I do?" Prescriptive analytics emphasises the importance of employing various techniques, such as knowledge graphs for inferences and neural networks. Additionally, cognitive analytics is crucial in identifying unknowns and raising awareness of overlooked factors.
Analysts should focus on providing a range of options rather than a single answer, utilising optimisation to assess the pros and cons to inform decision-making. Howard references the DIKWA (Data, Information, Knowledge, Wisdom, Action) model, which underlines the importance of enhancing data maturity to answer more complex questions effectively.
Addressing Data-Disability in Organizational Culture
The concept of organisational culture can greatly influence a company's shift towards being data-driven or knowledge-driven. A common challenge arises when employees exhibit a "data disabled" mindset, characterised by a lack of trust in the quality of data presented through graphs and information. This scepticism necessitates the involvement of change managers who can address these concerns and guide employees from a state of resistance to becoming "data-enabled." By improving Data Quality, ensuring reliable dashboards, and fostering trust in Business Intelligence (BI) reports, organisations can facilitate a more positive engagement with data, ultimately leading to informed decision-making and understanding of underlying trends.
The Transition to Data-Driven Thinking
The transition to a data-driven approach involves relying on accurate forecasting and predictions to guide decision-making, where the data is trusted over subjective analysis or external consultations. Understanding where one stands in the analysis continuum is crucial, as it helps identify data sophistication, stakeholder positions, and relevant business questions.
Building a strong data culture takes time and consistent effort; it's not an overnight shift. A practical example illustrates the importance of trust and accountability in project management, where failure to deliver as promised can undermine one's reputation and necessitate increased scrutiny from stakeholders in future interactions. Hence, demonstrating reliability over time is essential for rebuilding trust.
Understanding Data Warehousing and Big Data
In Data Management, it is crucial to ensure that business decisions are grounded in accurate data analyses, as incorrect interpretations can lead to setbacks. Effective Data Management requires a comprehensive understanding of assets, maturity, and measurement continuums to streamline processes.
The DMBoK (Data Management Body of Knowledge) framework differentiates between Data Warehousing, Business Intelligence (BI), and Big Data analytics, highlighting the need for rigorous methods to derive insights from large datasets. This includes transitioning from Version 2, which focuses on uncovering unknown questions, to a more structured approach that integrates various stages of data processing. Ultimately, establishing a solid foundation by Data Managers allows teams to focus on necessary analytical work to drive informed decision-making.
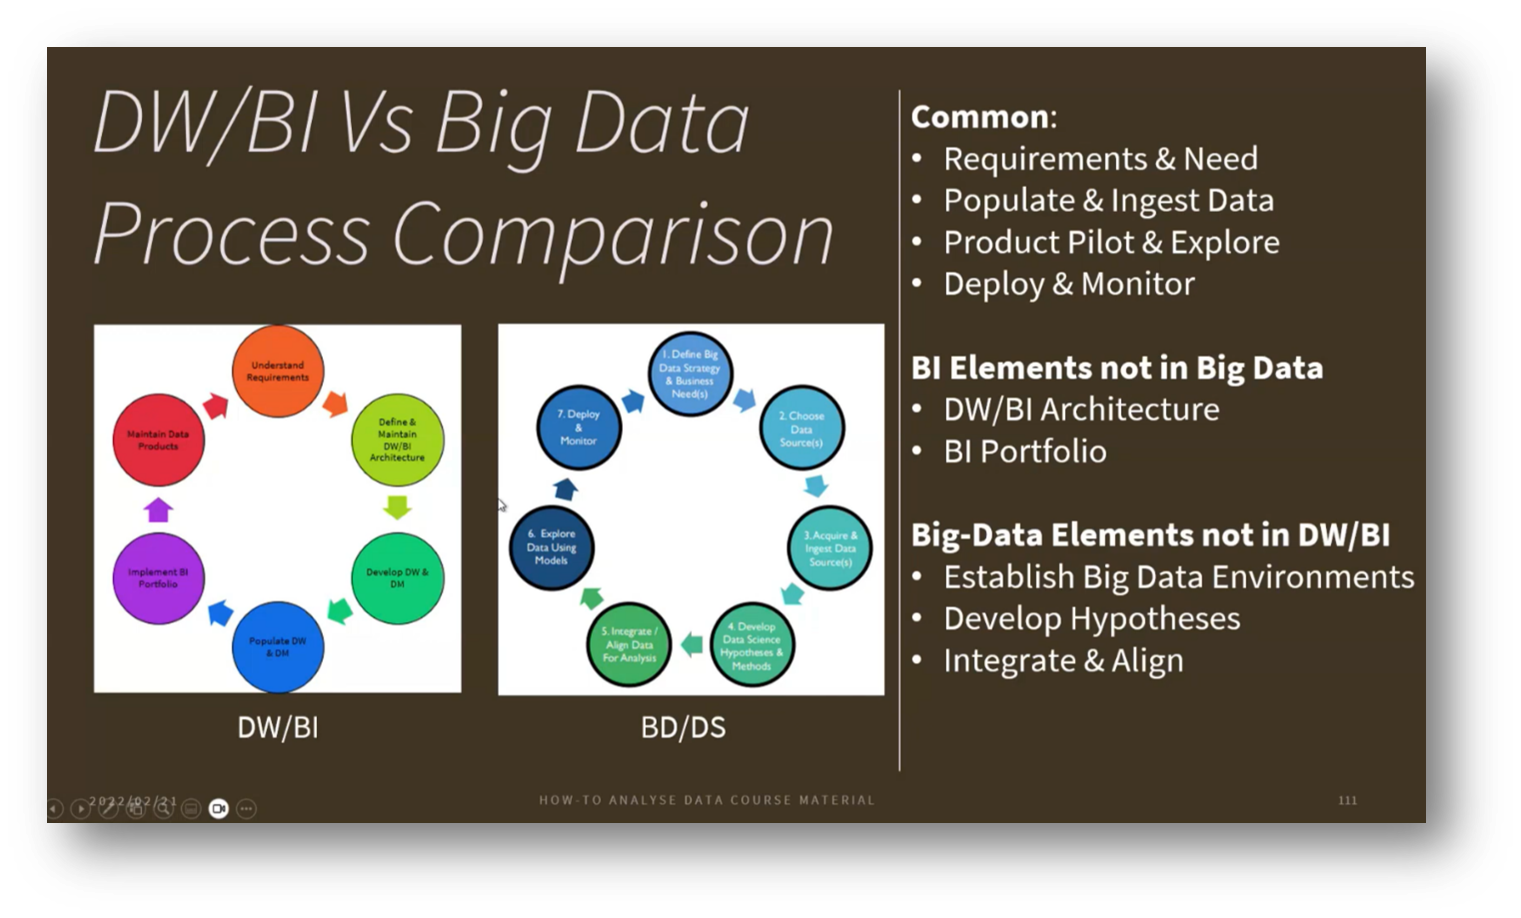
Figure 6 DW/BI Vs Big Data Process Comparison
Data Warehousing and AI in Business Decision Support
The focus moves on integrating Business Intelligence (BI) and Artificial Intelligence (AI) to support decision-making and empower knowledge workers in data analysis. Howard notes that an effective platform should consolidate operational data from various business processes to provide a comprehensive overview, especially when investigating declining revenue. While BI and Data Warehousing can be systematically structured and controlled, allowing for clearer road maps and user acceptance testing. Additionally, Big Data projects tend to be less predictable and require more time to explore and validate hypotheses. Challenges in Big Data include potential delays in model deployment and the need for mature, accurate models to avoid false positives and negatives, which can lead to frustration among users when expectations are not met.
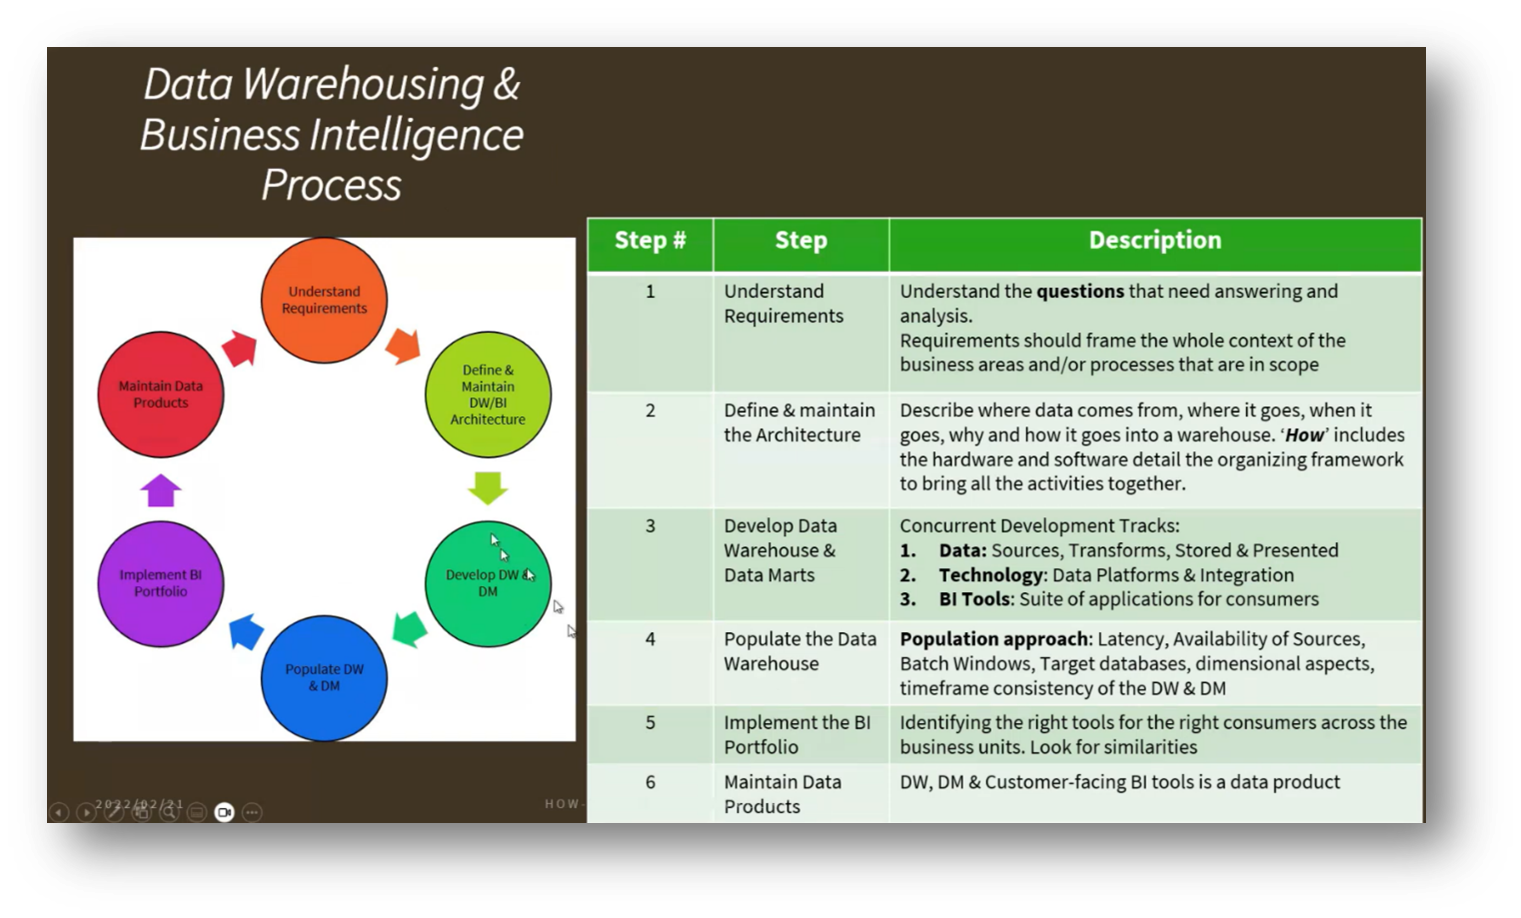
Figure 7 Data Warehousing & Business Intelligence Process
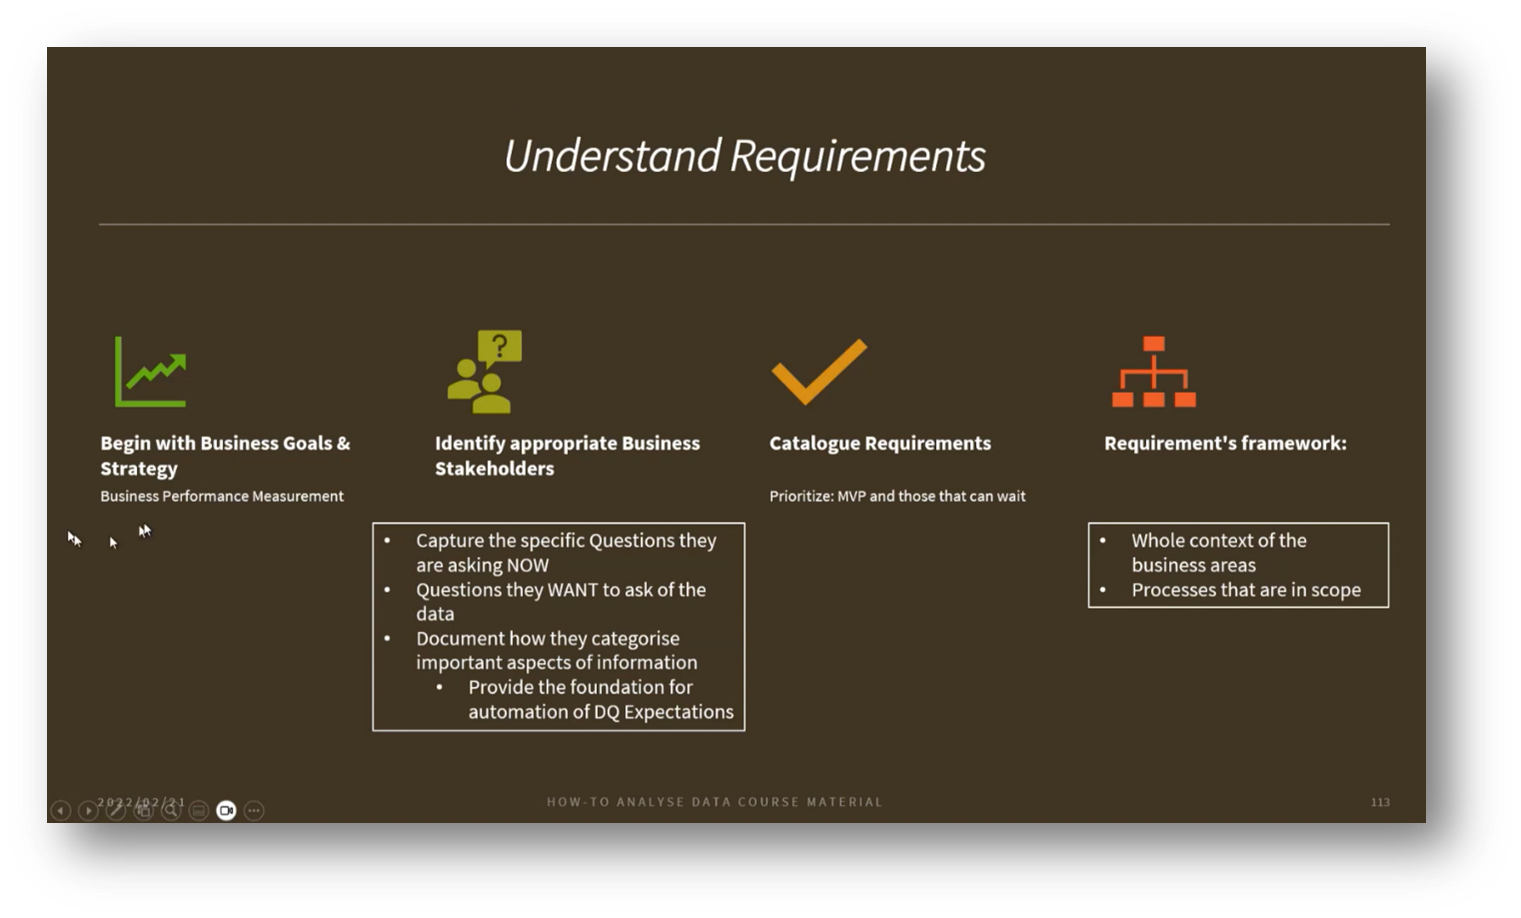
Figure 8 Understand Requirements
Common Aspects of Data Management and Business Innovation
Both Business Intelligence and data analysis share common goals, primarily focused on fulfilling business requirements and needs by posing relevant questions. They involve the ability to gather and process data in various structures, as well as building pilot data products to uncover valuable insights. Furthermore, these approaches can generate ideas for business innovation, demonstrating that insights stem not only from Big Data but also from a solid understanding of business processes. Additionally, both methodologies require the deployment and monitoring of data operations, often referred to as DevOps or ML Ops, to ensure the efficient deployment of data and machine learning models.
Understanding the Differences of Data Warehousing and Big Data
The evolution of Data Management is marked by the emergence of the Data Lake House, which integrates a data warehouse framework on top of a Data Lake to standardise transformations across data scientists, diverging from traditional Big Data approaches. This model aims to create a common data source for Business Intelligence (BI) while emphasising the unique aspects of Big Data environments, such as the preparation of training datasets. It involves developing hypotheses based on customer responses and refining decision-making processes through probing and sensing. Additionally, integrating and aligning disparate data sources—often from external sites—requires a thorough understanding of Metadata and master data, distinguishing it from conventional internal systems like ERP. While Data Warehousing processes are well-defined with predictable outcomes, Data Science introduces uncertainties related to data completeness and challenges in establishing causation versus correlation, highlighting the complexities in deriving insights.
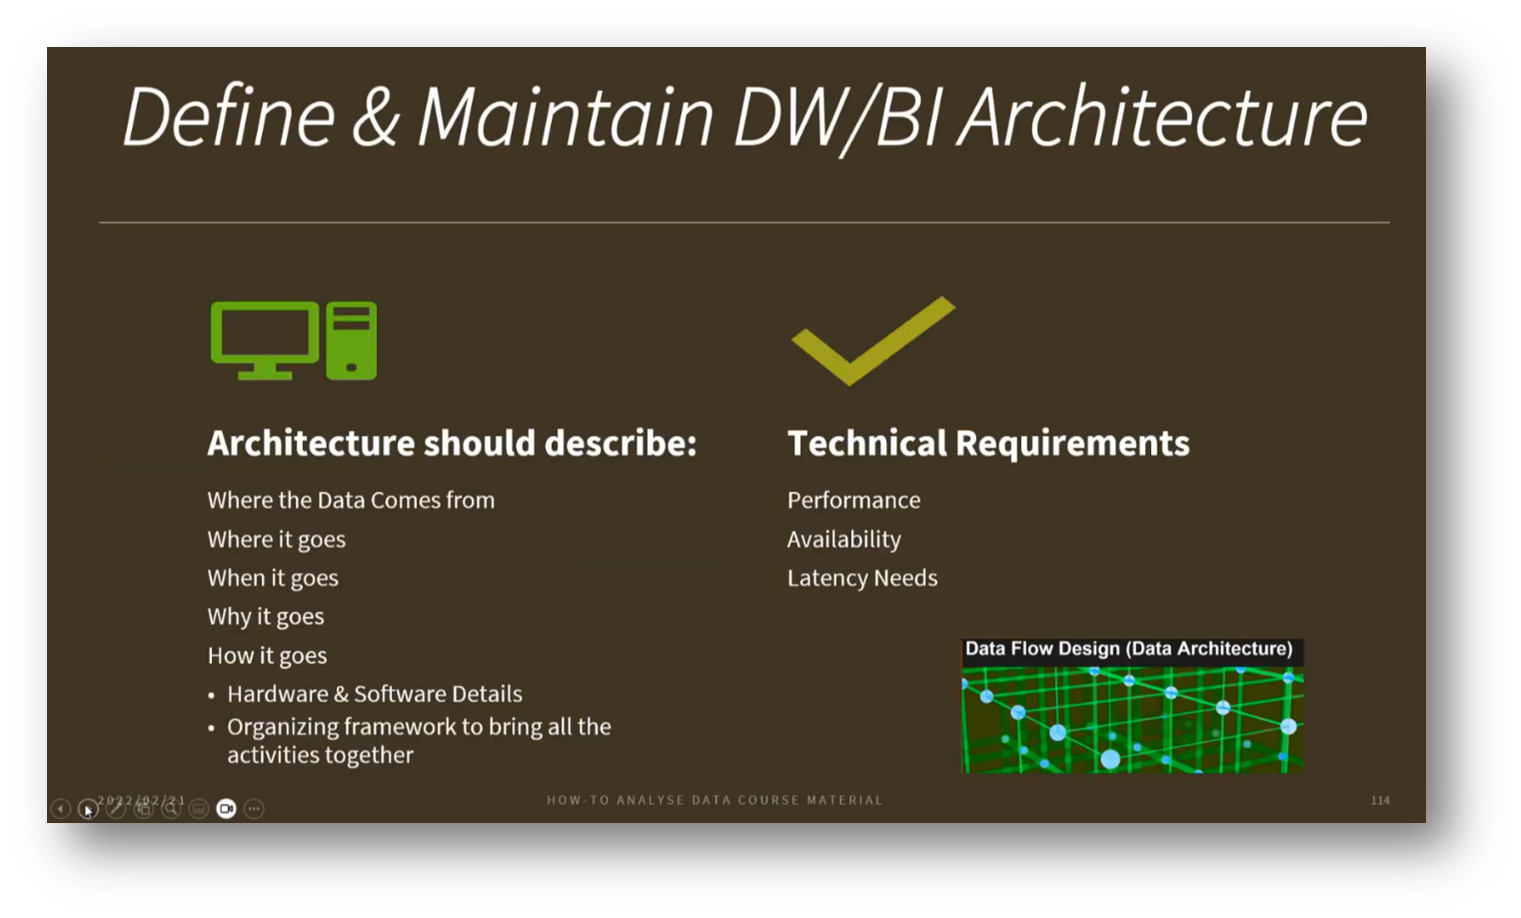
Figure 9 Define & Maintain DW/BI Architecture
The BI Process and its Importance in Business Performance Measurement
The ABI (Analytics Business Intelligence) process involves understanding business goals, strategy, and performance to effectively measure metrics such as budget versus actual results. While BI excels in performance measurement, it often struggles to explain underlying reasons for trends, such as declining sales or customer retention. To address these challenges, it is essential to identify stakeholders for each Key Performance Indicator (KPI) and prioritise data products based on business requirements. This includes building a comprehensive requirements framework and establishing a proper architecture with crucial elements like data lineage and data catalogues. Ensuring that all Metadata is readily accessible empowers business users to trace the origins of report data and seek clarification when needed, ultimately enhancing data asset management.
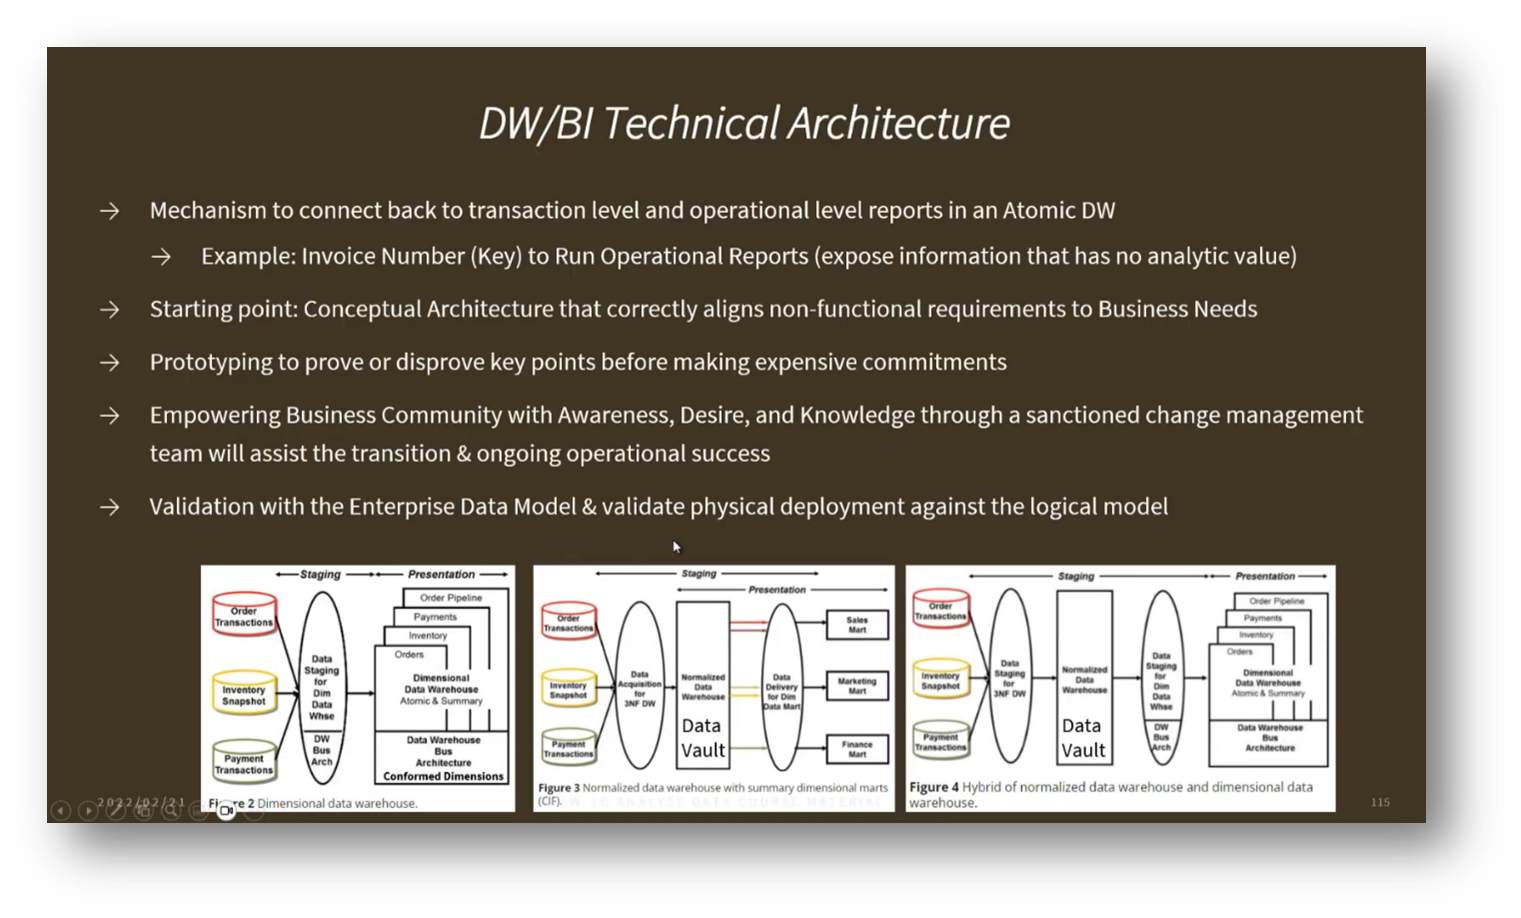
Figure 10 DW/BI Technical Architecture
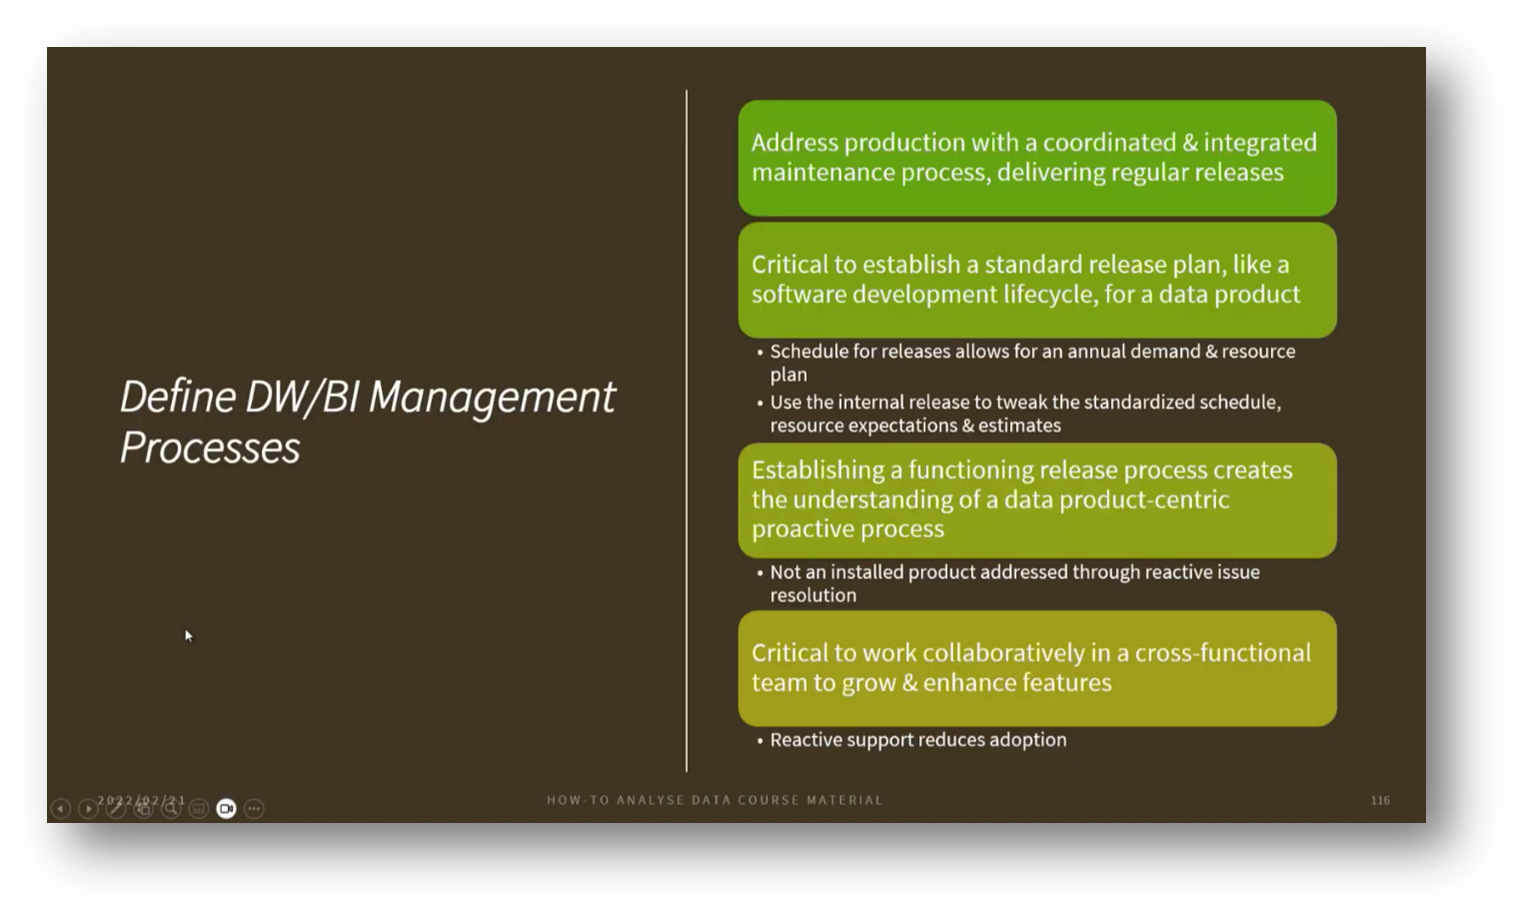
Figure 11 Define DW/BI Management Processes
Evolution and Impact of Data Warehouse Models
The Data Vault approach represents a shift from traditional dimensional modelling and data warehouses to a more flexible framework for data integration. Unlike classical models that enforce strict quality measures that can inadvertently exclude valuable data, Data Vaults utilise a normalised data structure focused on core business concepts and their relationships. This involves creating "hubs" to capture essential identifiers, such as customer codes, while also establishing "satellites" to store descriptive attributes. This allows for the inclusion of varied data sources, such as marketing interactions with customers who may not have complete information, thereby facilitating a more inclusive Enterprise Data Warehouse that supports effective analytics without compromising on Data Quality.
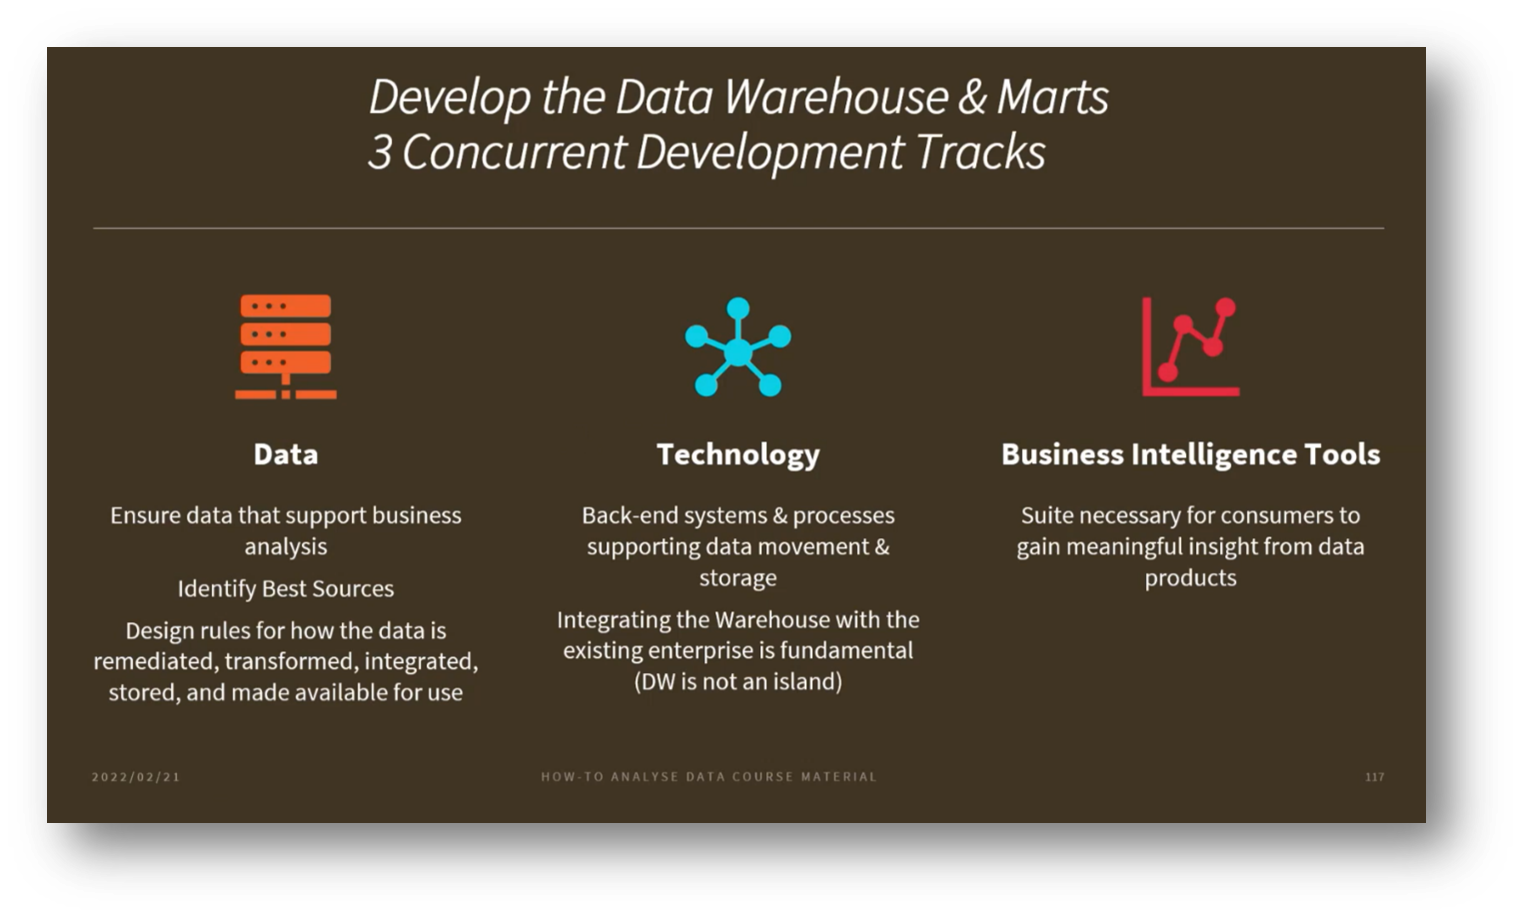
Figure 12 Develop the Data Warehouse & Marts
Understanding the Dynamics of Data Warehousing and Integration
The management process in Data Warehousing typically involves three main tracks: Data Architecture, technology requirements, and Business Intelligence (BI) tools for data analysis. Key components include data integration, ETL processes, Data Quality, and Metadata Management, with a growing emphasis on Metadata-driven integration, particularly using ontologies to simplify transformation rules.
It’s critical to understand the characteristics of data sources—such as structure, format, and accuracy—to effectively integrate diverse data. User needs must also be considered when designing reporting tools, as different stakeholders, like executives, may prefer high-level PDF dashboards over interactive BI tools.
The Gartner analytics framework underlines the importance of people, processes, platforms, and Metadata in driving various analytics types. Effective data product management follows a release process guided by prioritised use cases, ensuring alignment with business needs and Data Strategy.
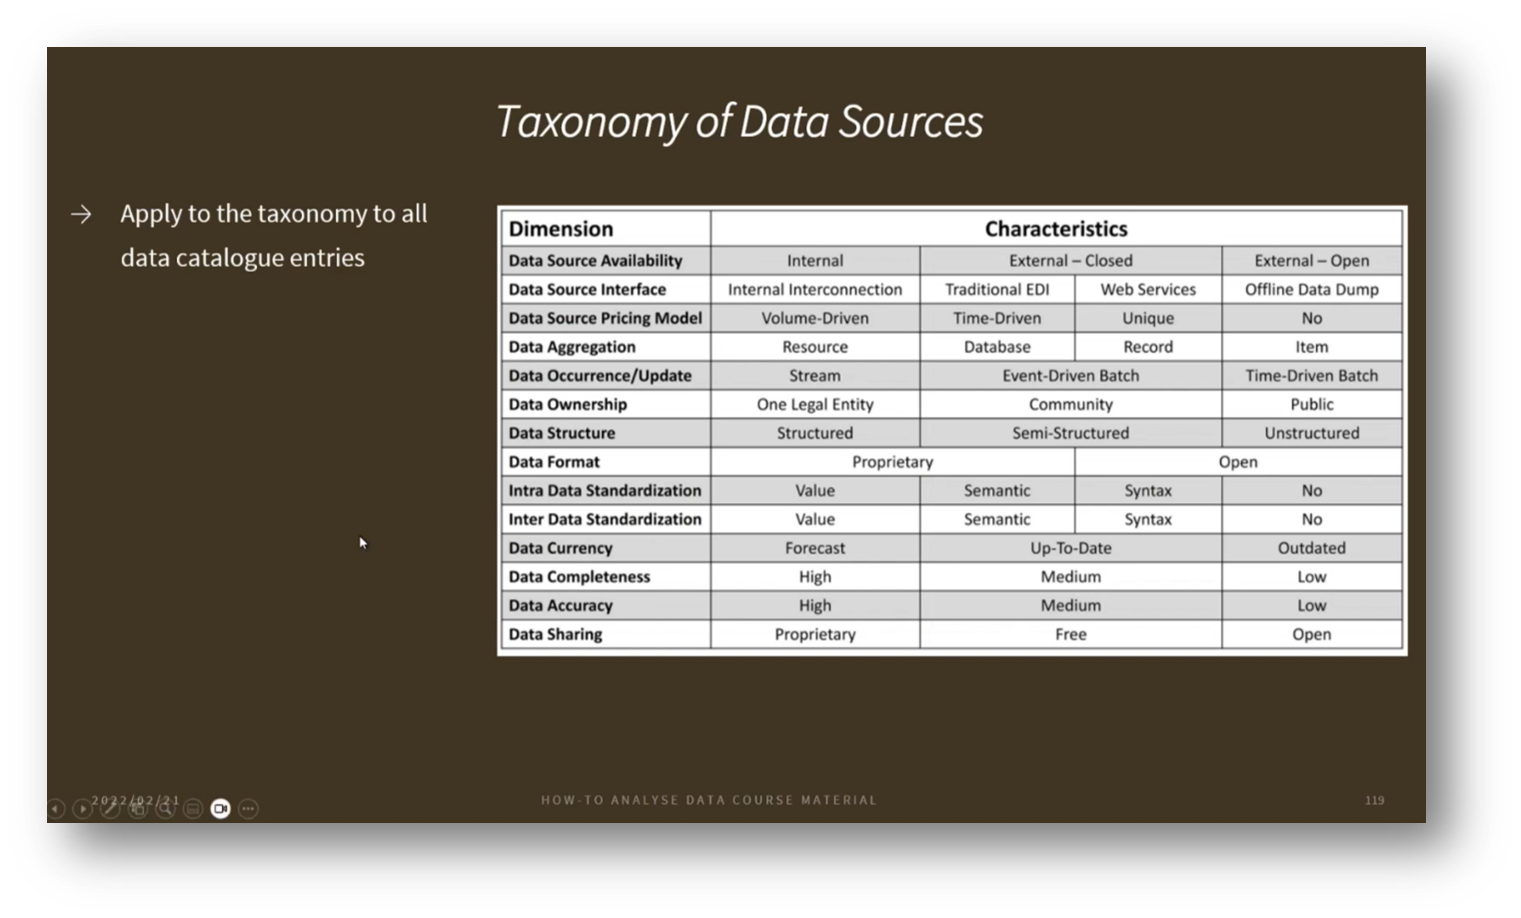
Figure 13 Taxonomy of Data Sources
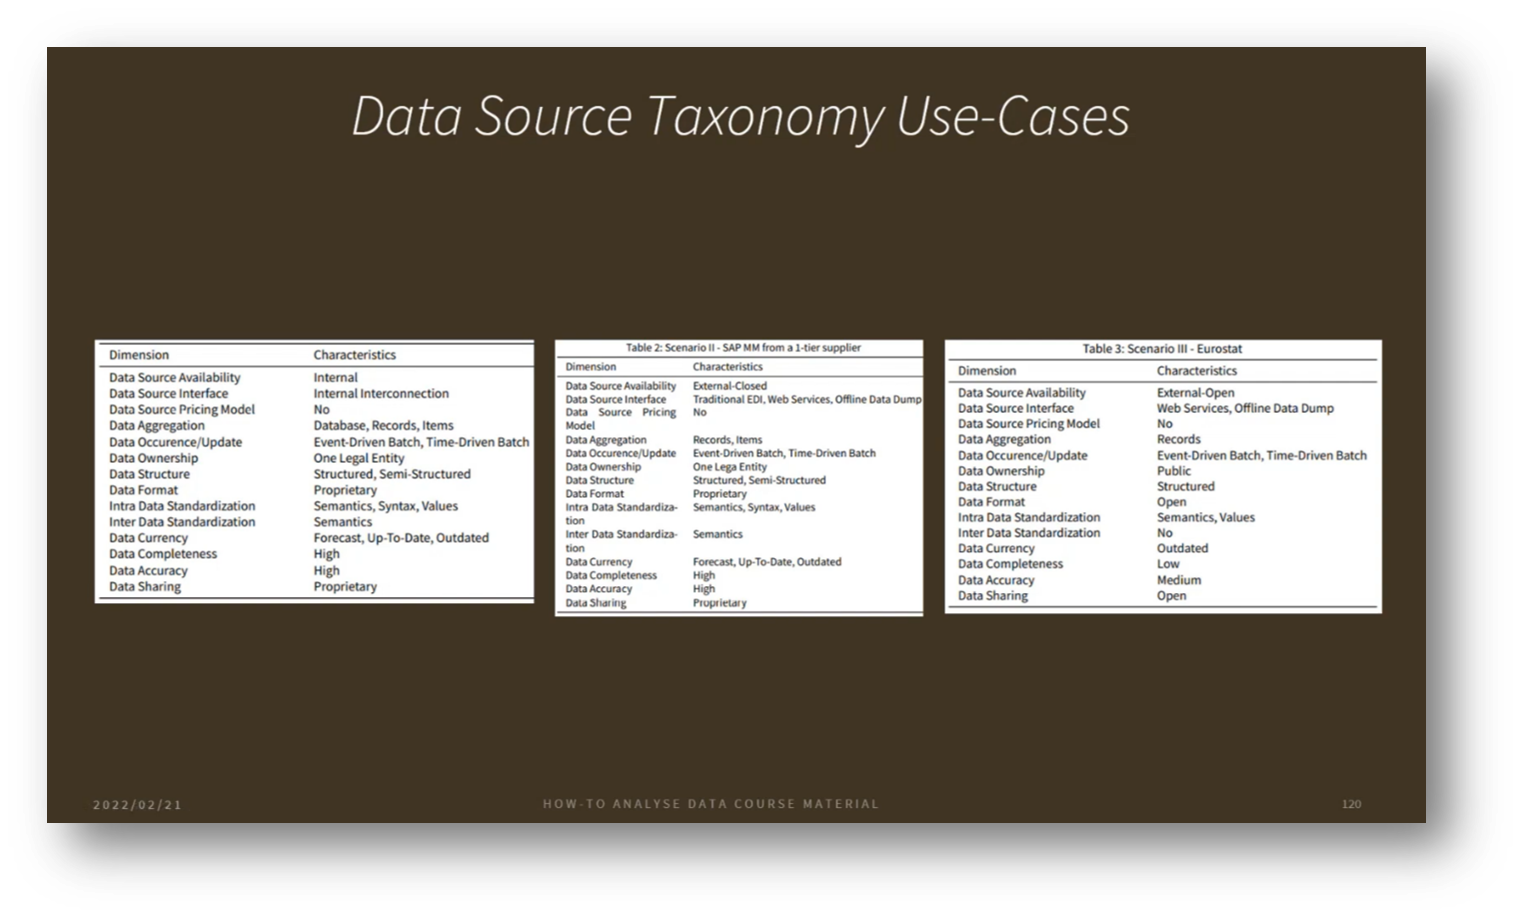
Figure 14 Data Source Taxonomy Use-Cases
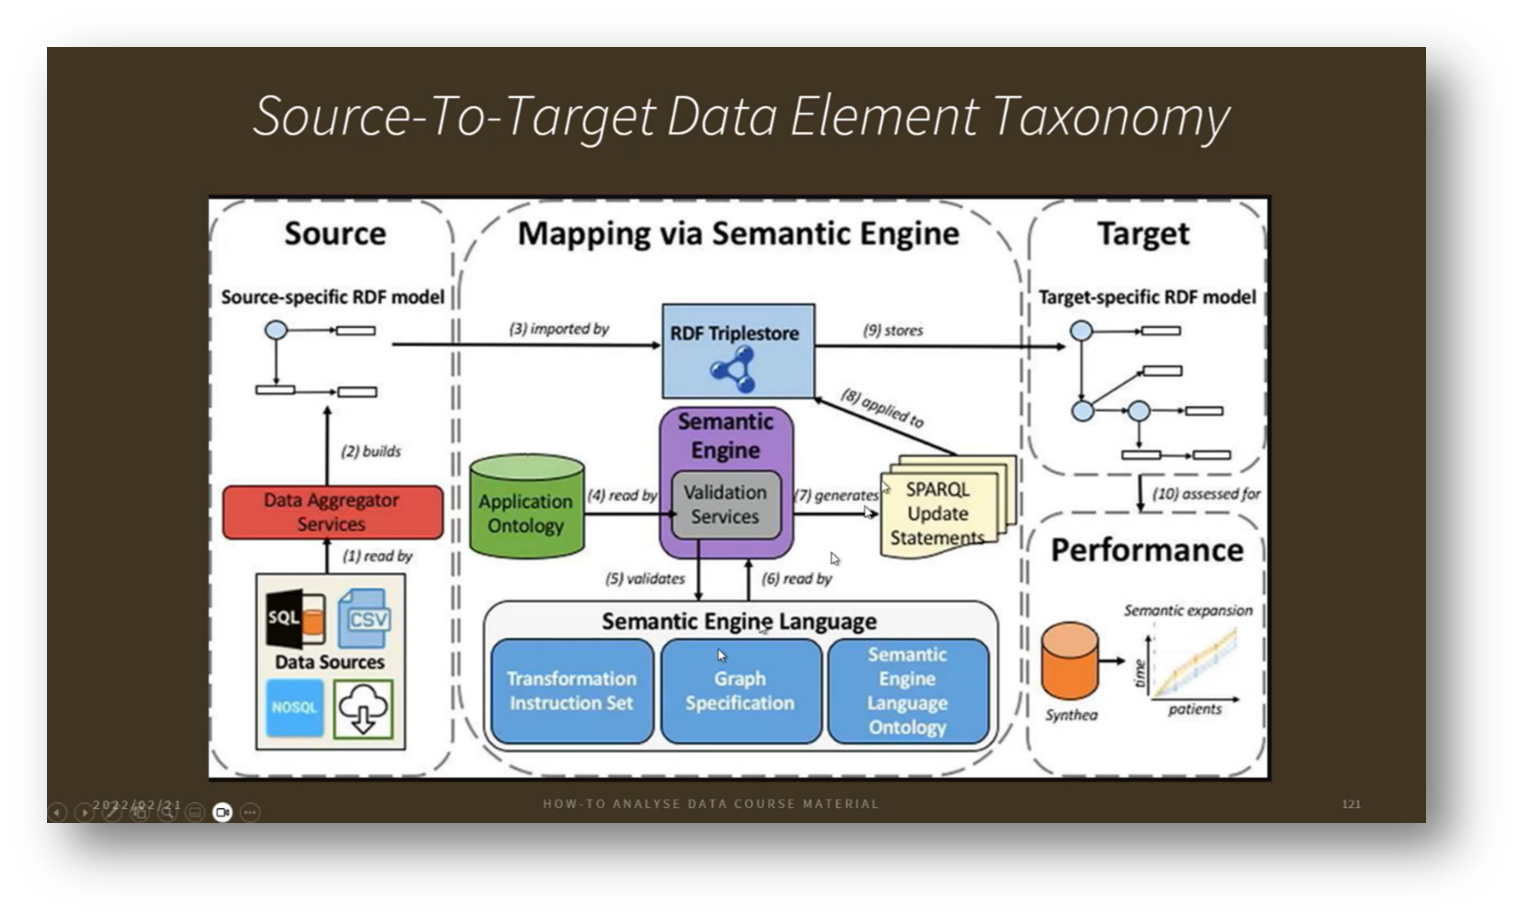
Figure 15 Source-To-Target Data Element Taxonomy
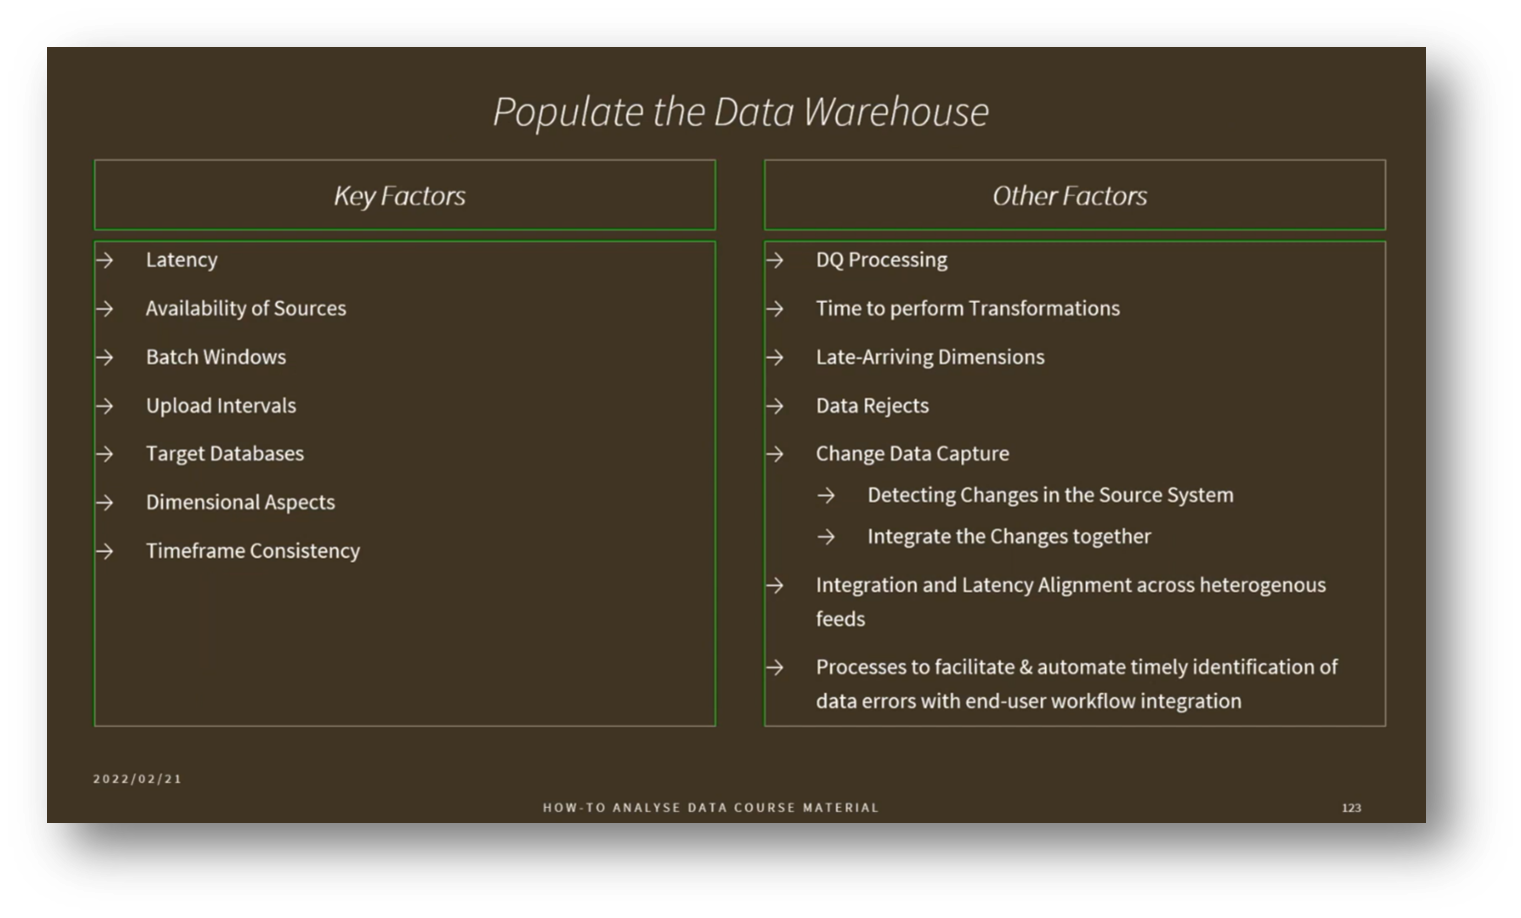
Figure 16 Populate the Data Warehouse
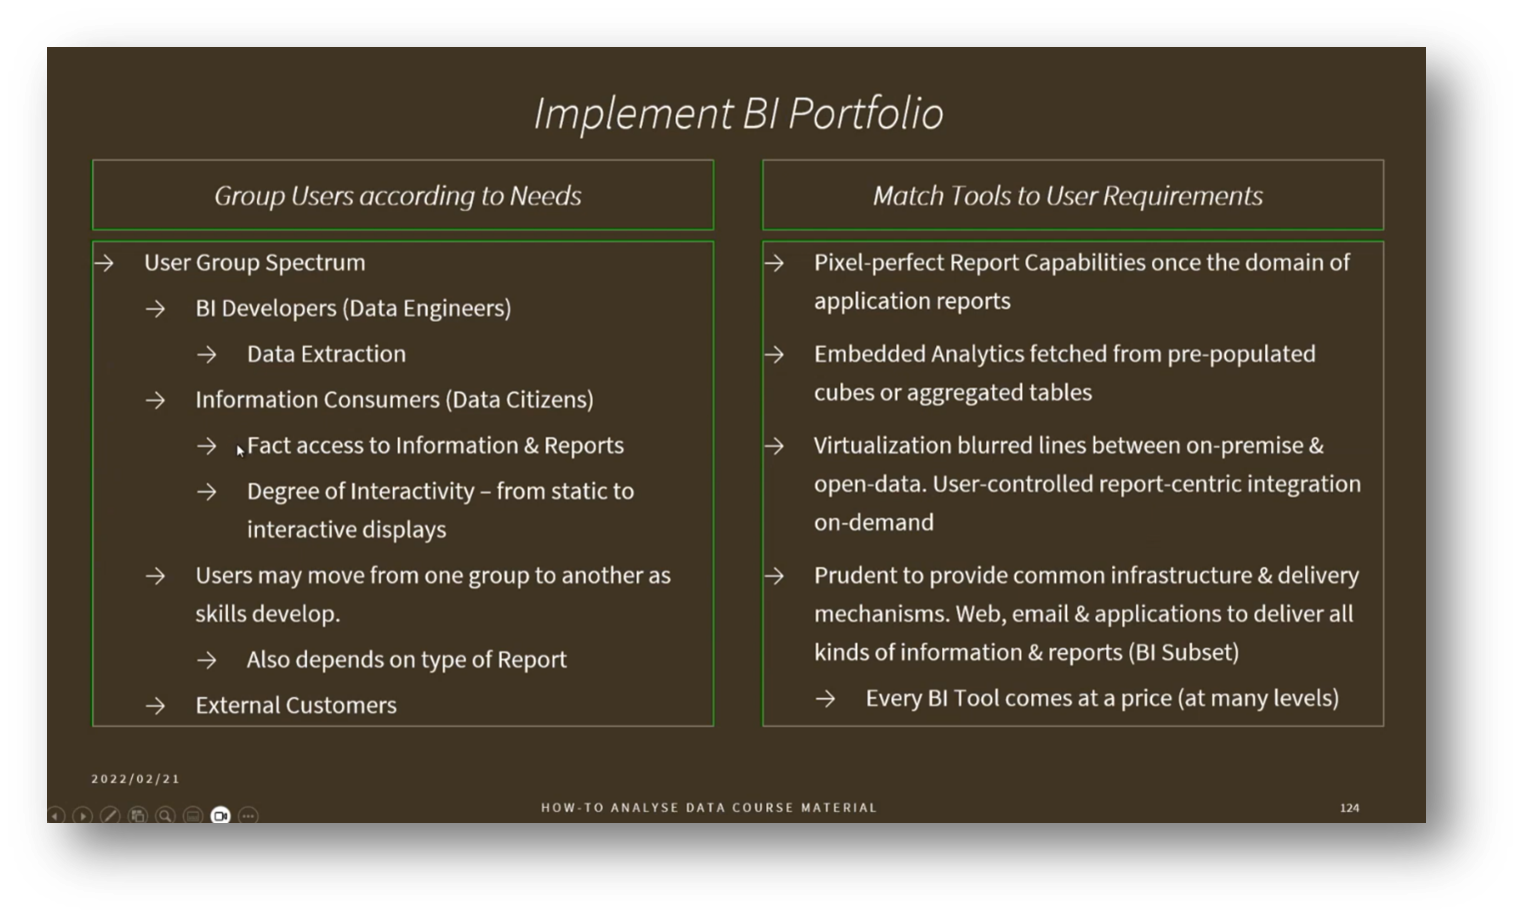
Figure 17 Implementing BI Portfolio
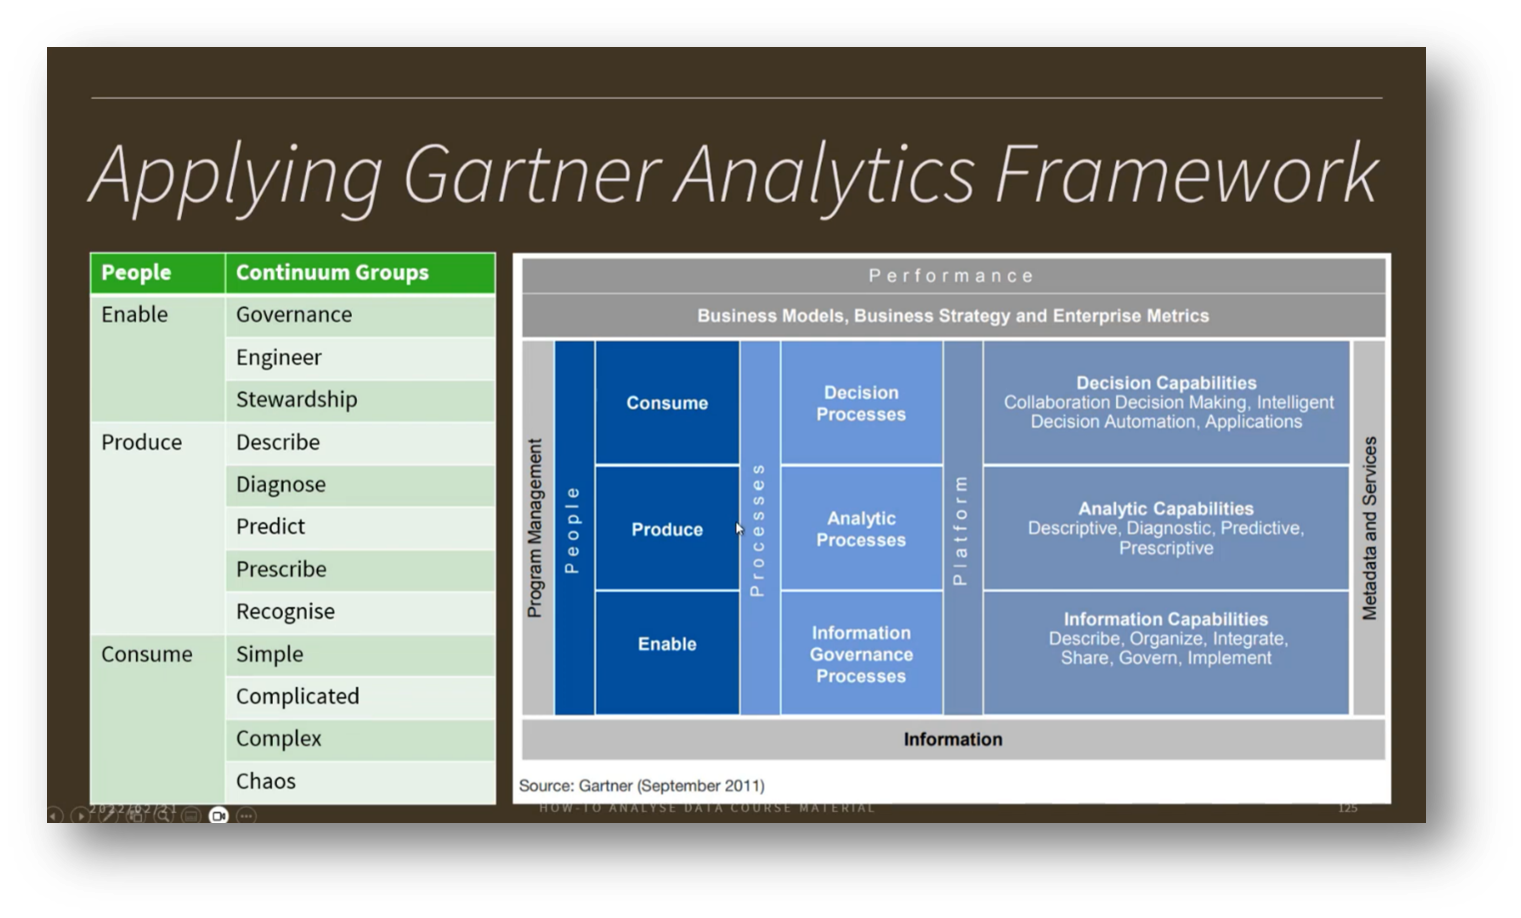
Figure 18 Applying Gartner Analytics Framework
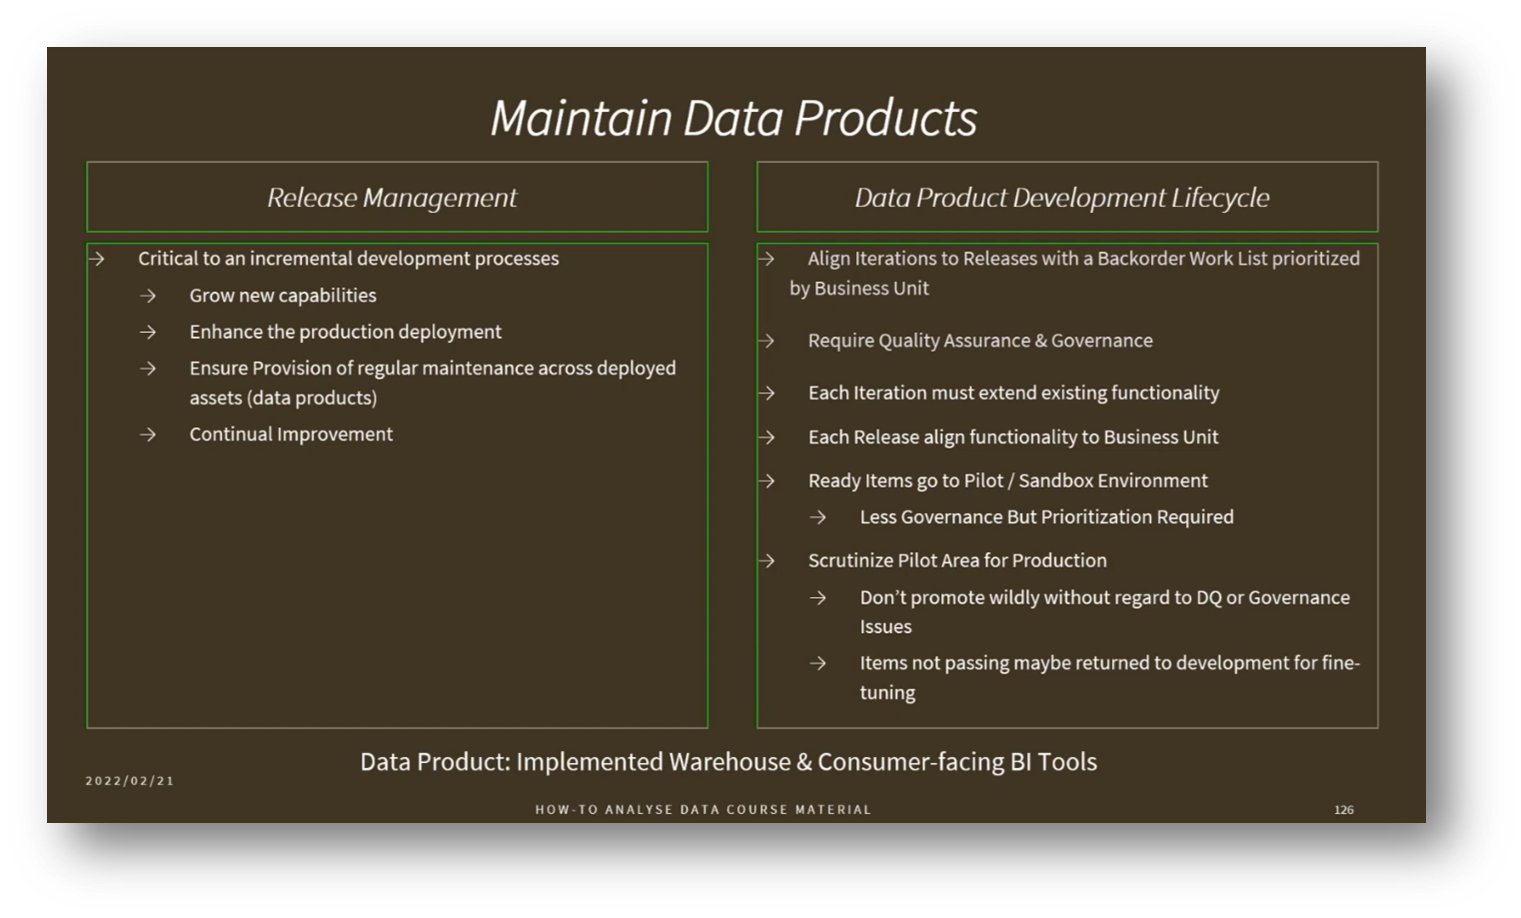
Figure 19 Maintain Data Products
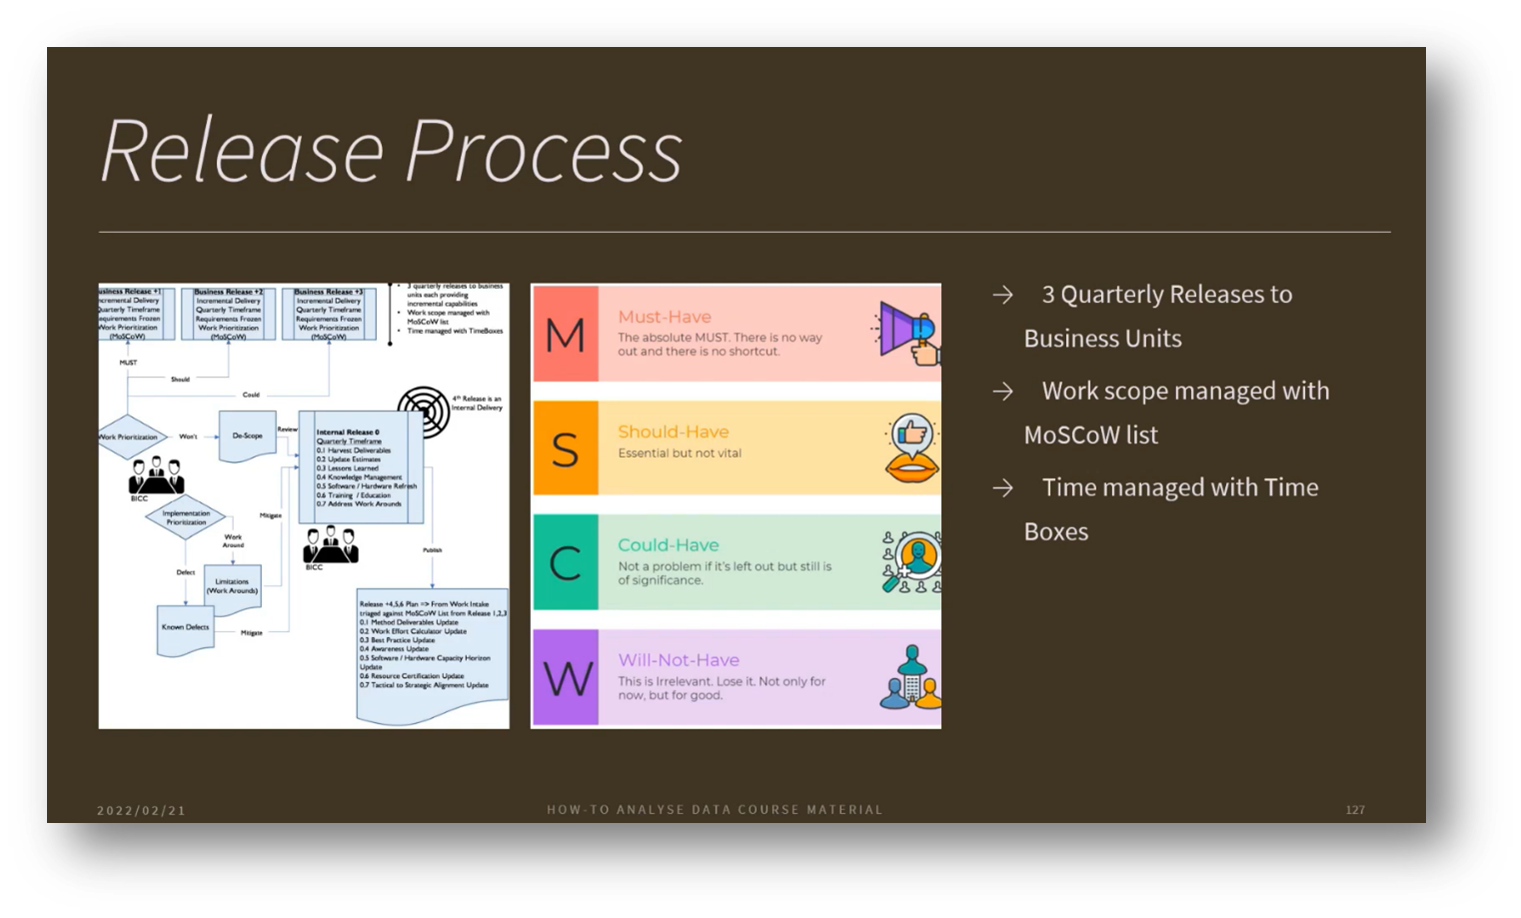
Figure 20 Release Process
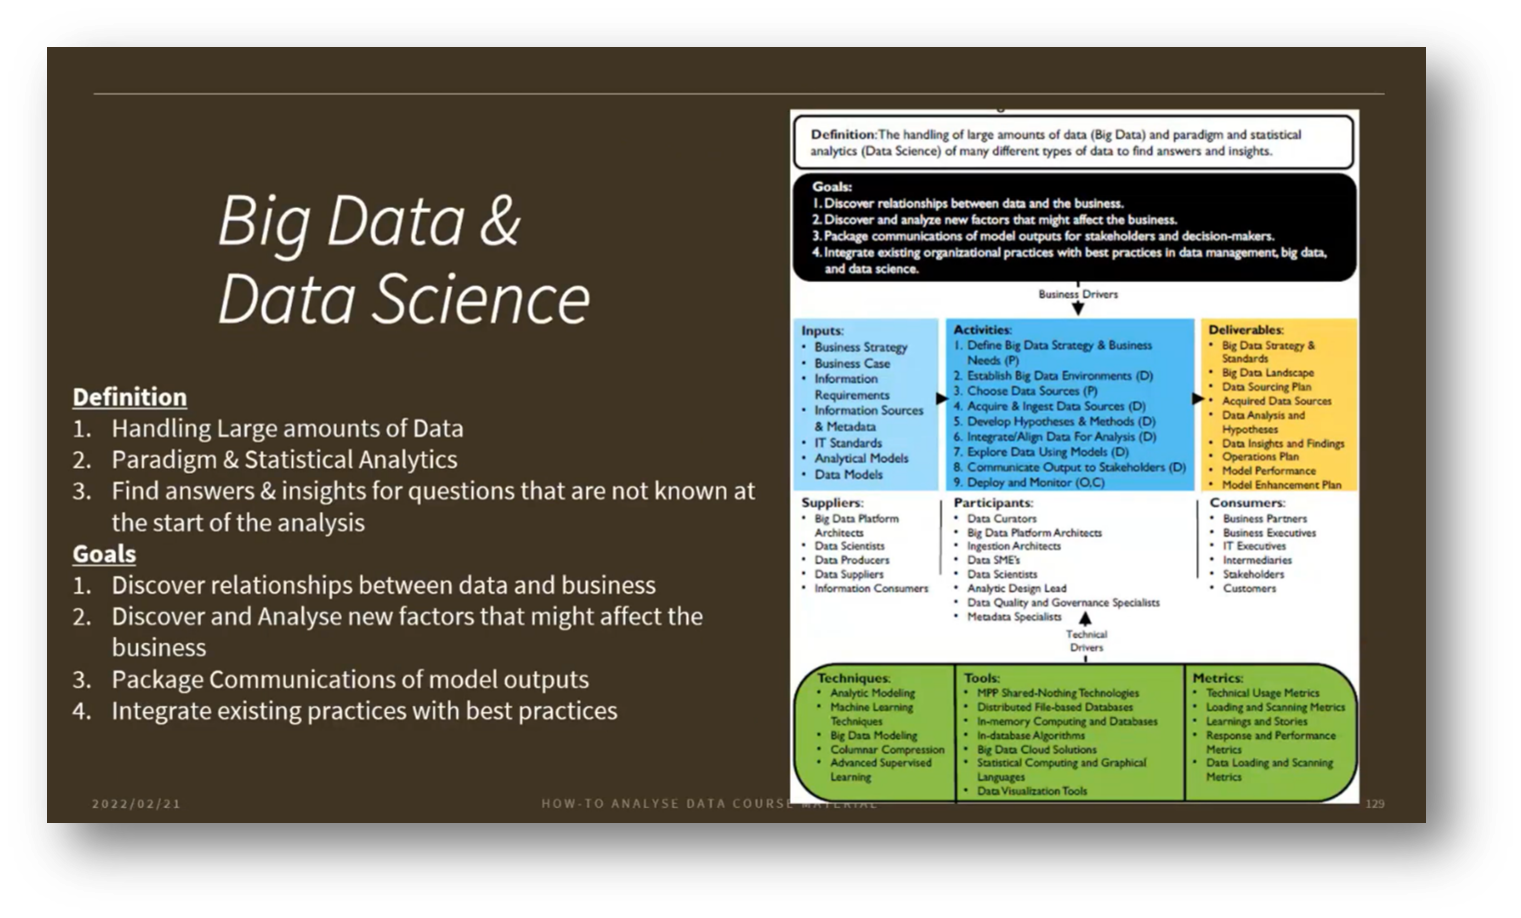
Figure 21 Big Data & Data Science
Data Science and AI
The Data Science process involves managing large amounts of data through platforms like cloud services and orchestration pipelines, such as Snowflake. A key aspect is distinguishing between shallow AI, which may develop models based on limited data, and deeper analyses that require extensive datasets, like astronomical information. The goal is to extract insights and answers from data, even if initial findings reveal only correlations rather than causation. This requires ongoing hypothesis development and data acquisition to deepen understanding.
Effective communication of complex data insights is vital, utilising innovative methods like data storytelling and visualisation. The process includes identifying needs, selecting appropriate data sources, exploring and analysing data, and refining models until they achieve maturity and reliability.
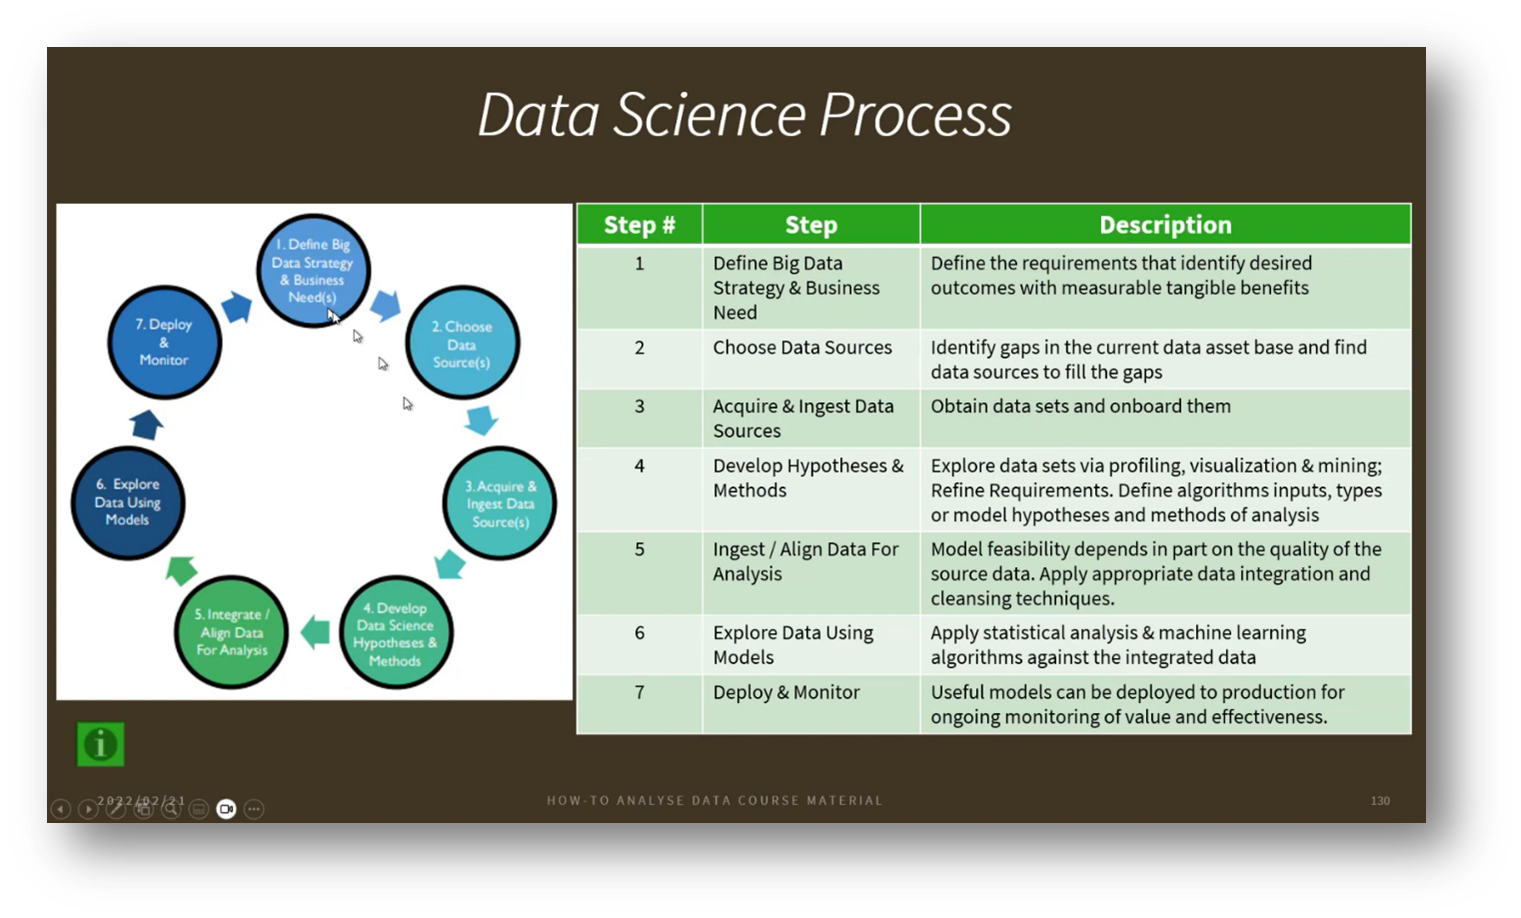
Figure 22 Data Science Process
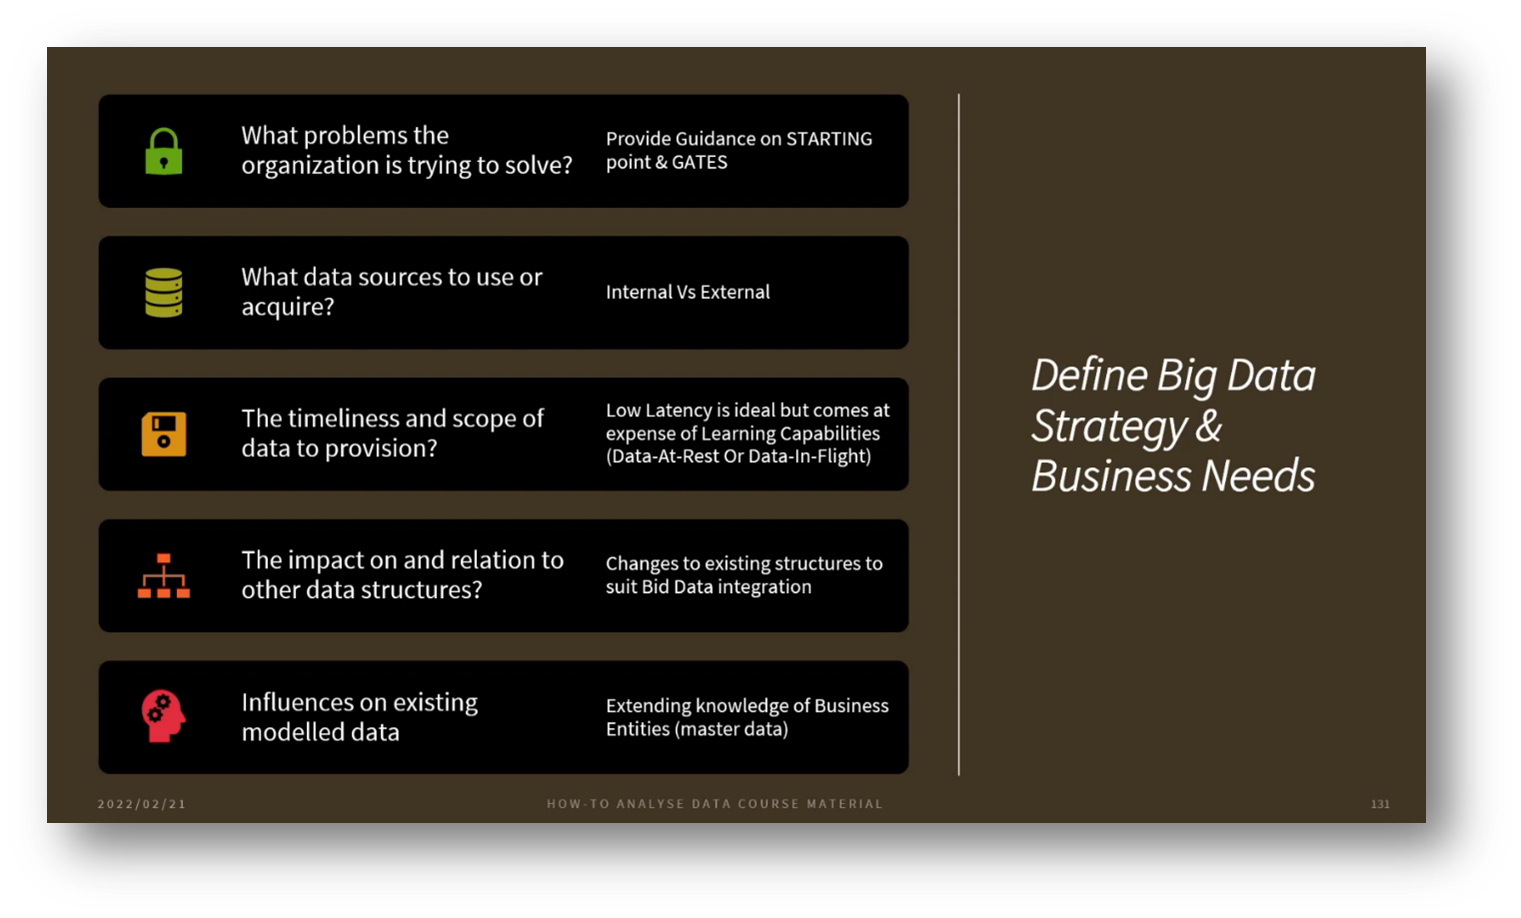
Figure 23 Define Big Data Strategy & Business Needs
The Implications of Synthetic Data in Machine Learning
The use of synthetic data has gained traction as organisations face bandwidth limitations in training machine learning models. While synthetic data is designed to replicate the original dataset and generate the necessary volume for model training, it risks reinforcing existing patterns and biases instead of introducing diversity.
To effectively utilise this data, robust governance is essential, focusing on assessing data sources, identifying and mitigating biases, and understanding the implications of various features within the dataset. Employing Metadata to understand relationships between data columns and establishing data trust evaluations based on foundational criteria like granularity and reliability are crucial steps. Additionally, ethical considerations regarding privacy and the potential for re-identification remain significant concerns, as current methods for anonymisation often fall short of ensuring complete security against re-identification attempts.
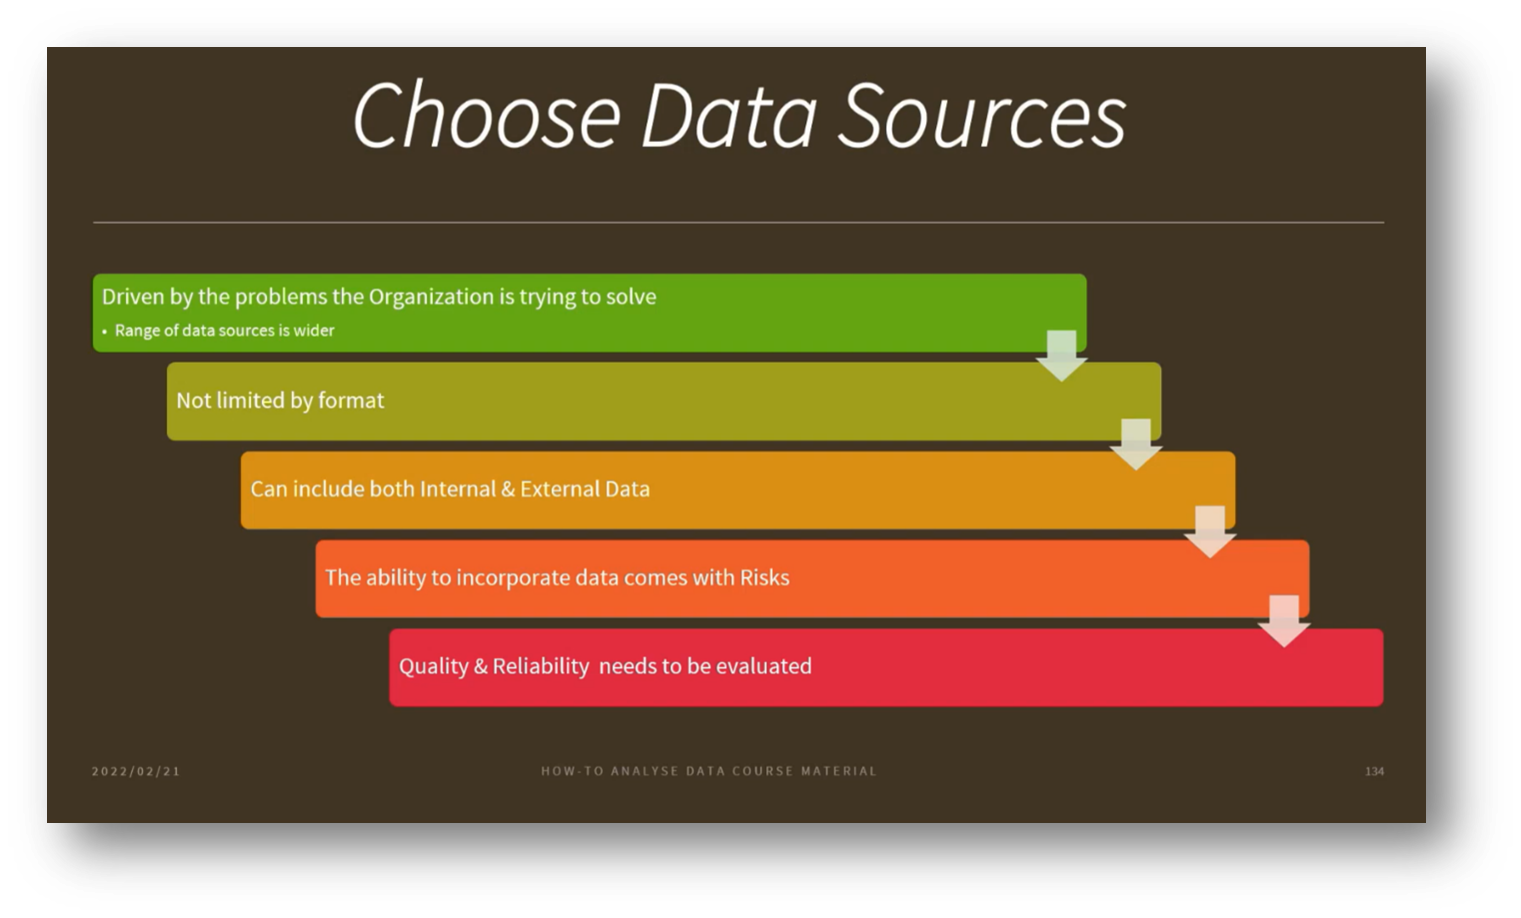
Figure 24 Choose Data Sources
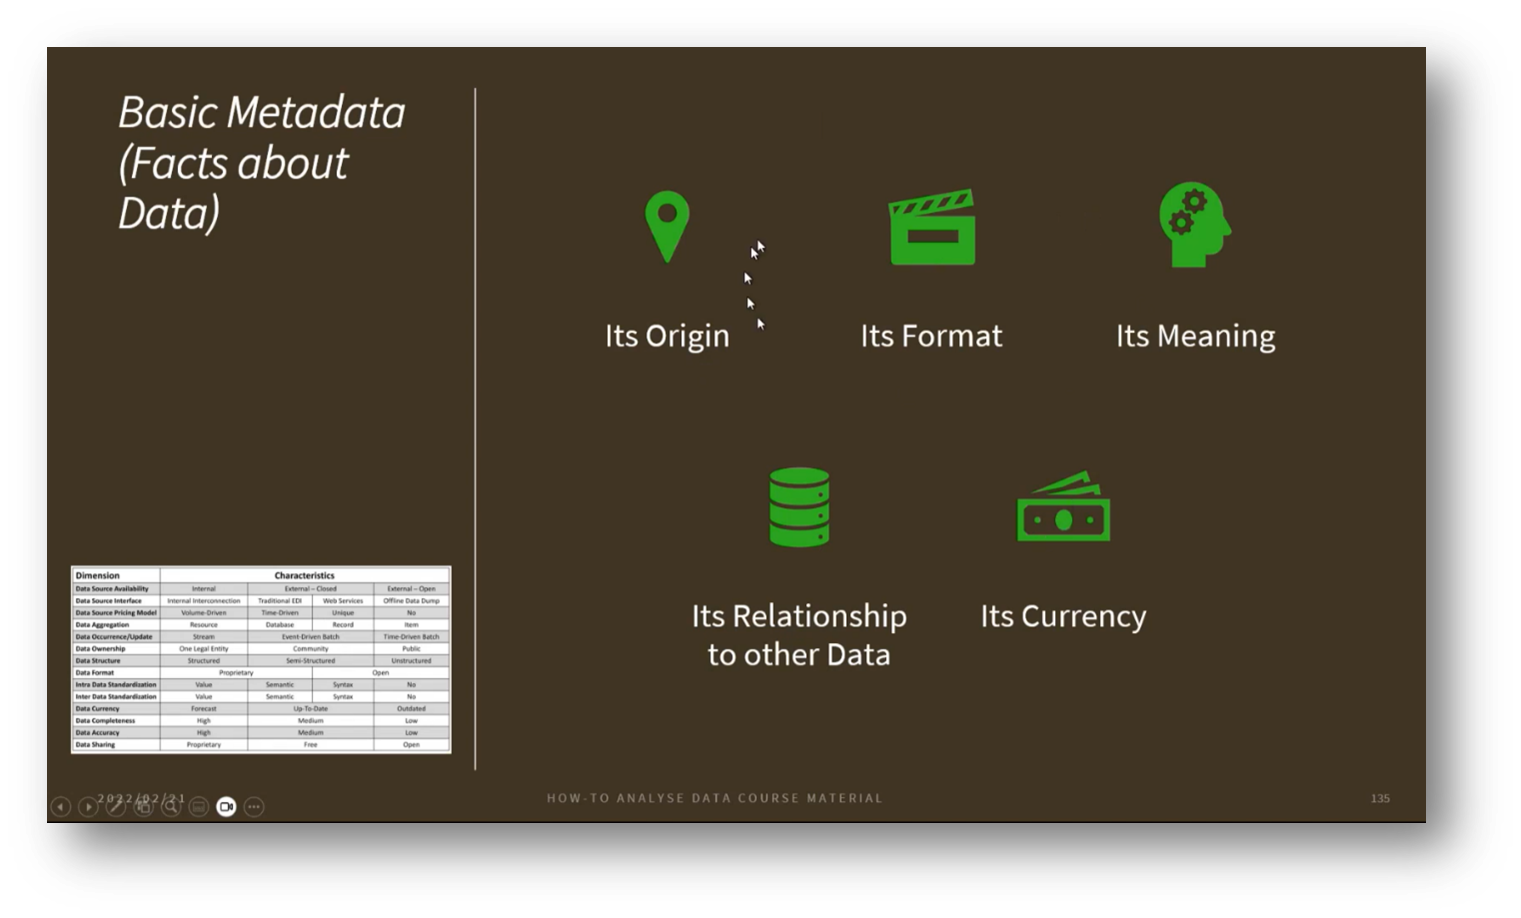
Figure 25 Basic Metadata (Facts about Data)
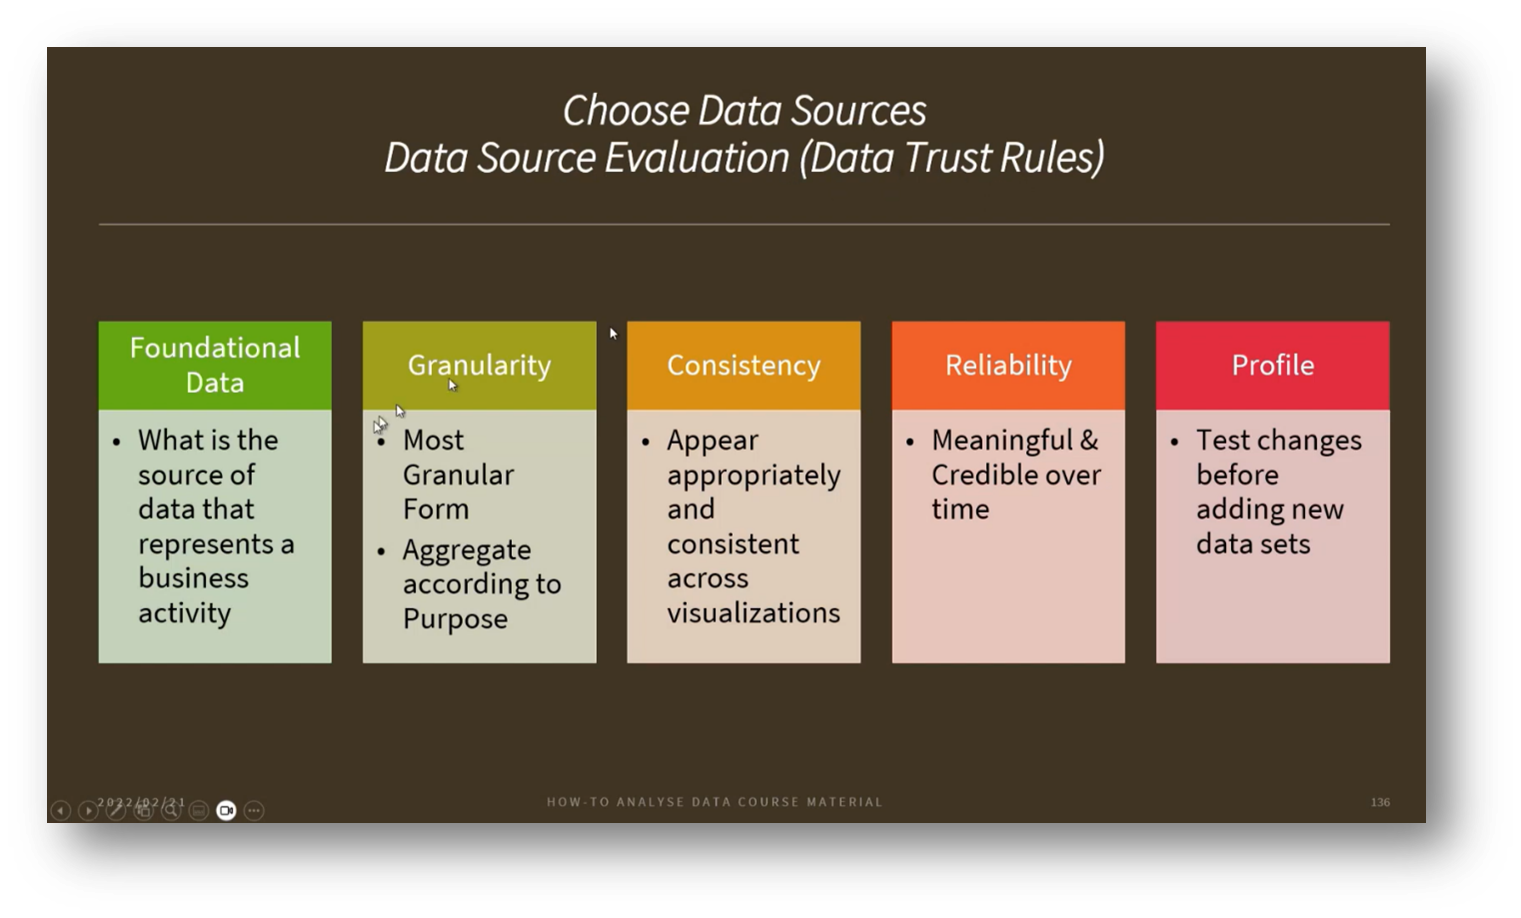
Figure 26 Data Source Evaluation (Data Trust Rules)
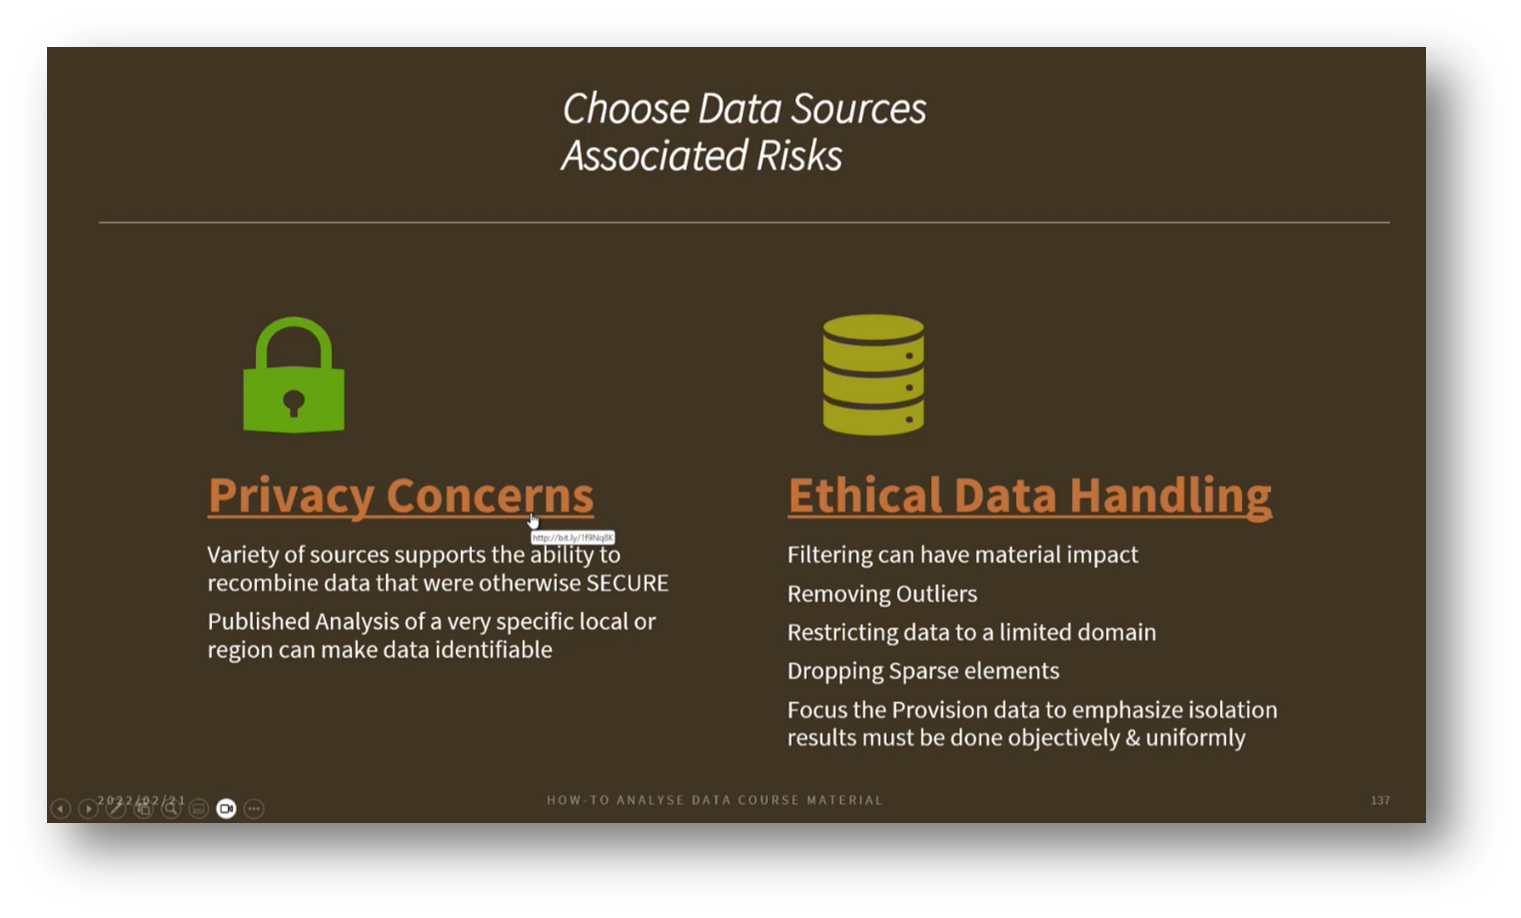
Figure 27 Choosing Data Sources Associated Risk
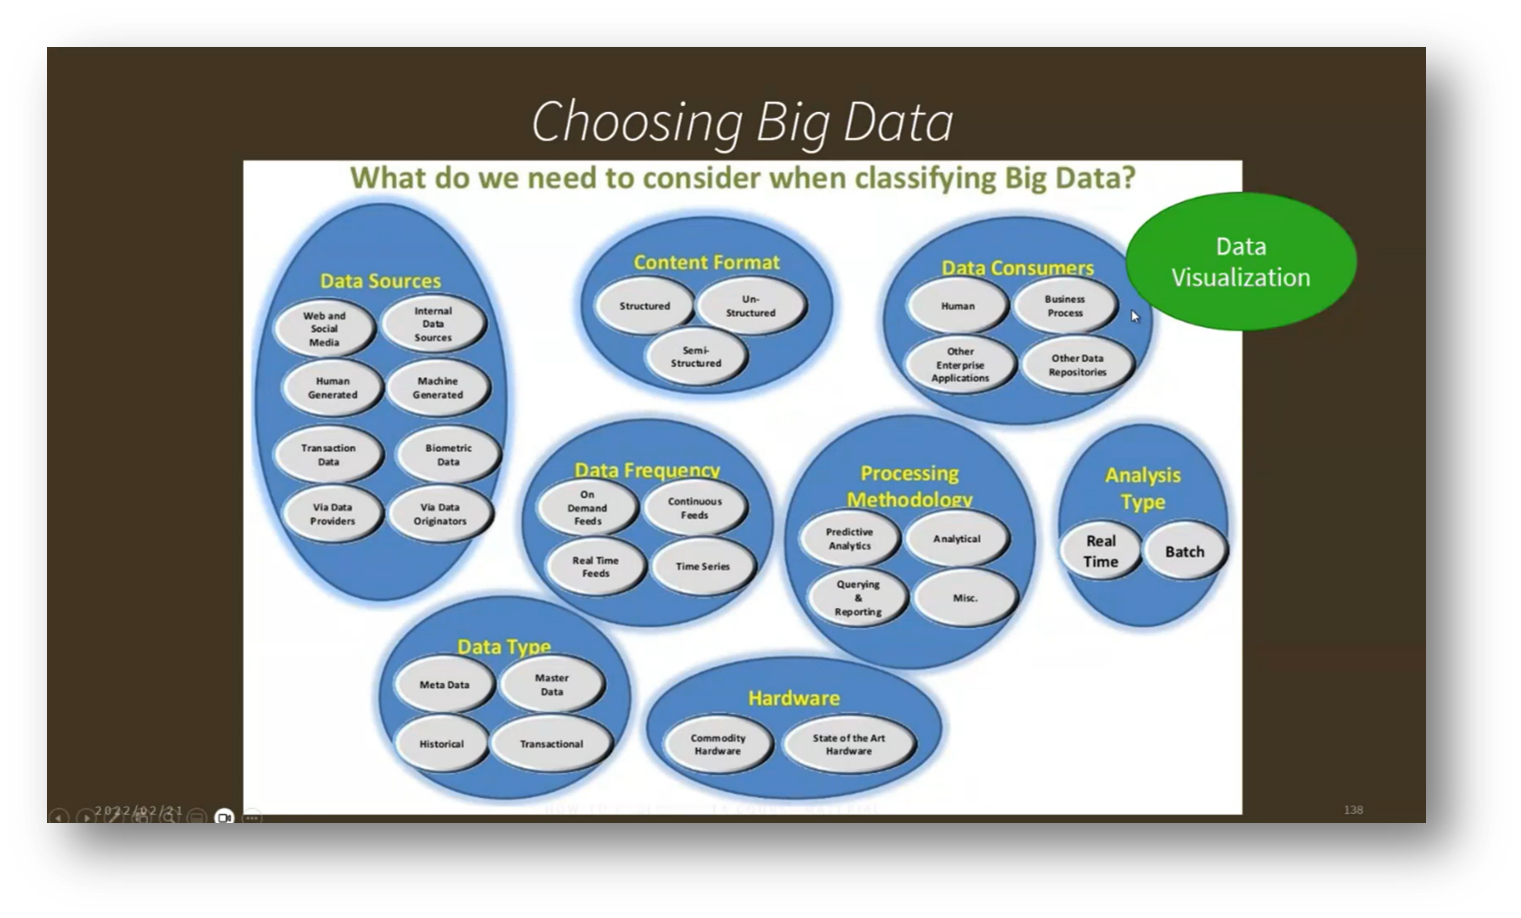
Figure 28 Choosing Big Data
Data Sources and Data Governance in Business
When choosing data sources, it's essential to consider various factors such as the type of data (internal web data, synthetic human-generated data, machine-generated biometric data), as well as the provenance, frequency, hardware requirements, and governance surrounding data acquisition.
Organisations should avoid the common pitfall of hastily bringing in new data without proper assessment of its appropriateness. Instead, industries are increasingly aligning specific use cases with suitable data types, including sensor server logs, social and geographic data, clickstream data, and both structured and unstructured user engagement metrics. This structured approach aids in effective Data Governance and empowers data leaders to identify and access valuable data more efficiently.

Figure 29 Big Data Type According to Business Needs
Statistical Models and Data Integration in Data Analysis
The process of developing hypotheses and statistical models involves understanding various states of information. These states may be categorised into four quadrants: known questions with known answers, known questions with unknown answers, unknown questions with known answers, and unknown questions with unknown answers.
Dealing with unknown questions and answers often entails working with chaotic data, which can be more time-consuming to resolve. A crucial aspect of this is data integration, where information from multiple datasets—such as article titles and authors or paper titles, authors, and journals—can be combined using techniques like joining or merging. This integration allows us to enhance our understanding by leveraging ontologies and constraints that describe the relationships within the data, leading to exciting advancements in the field.
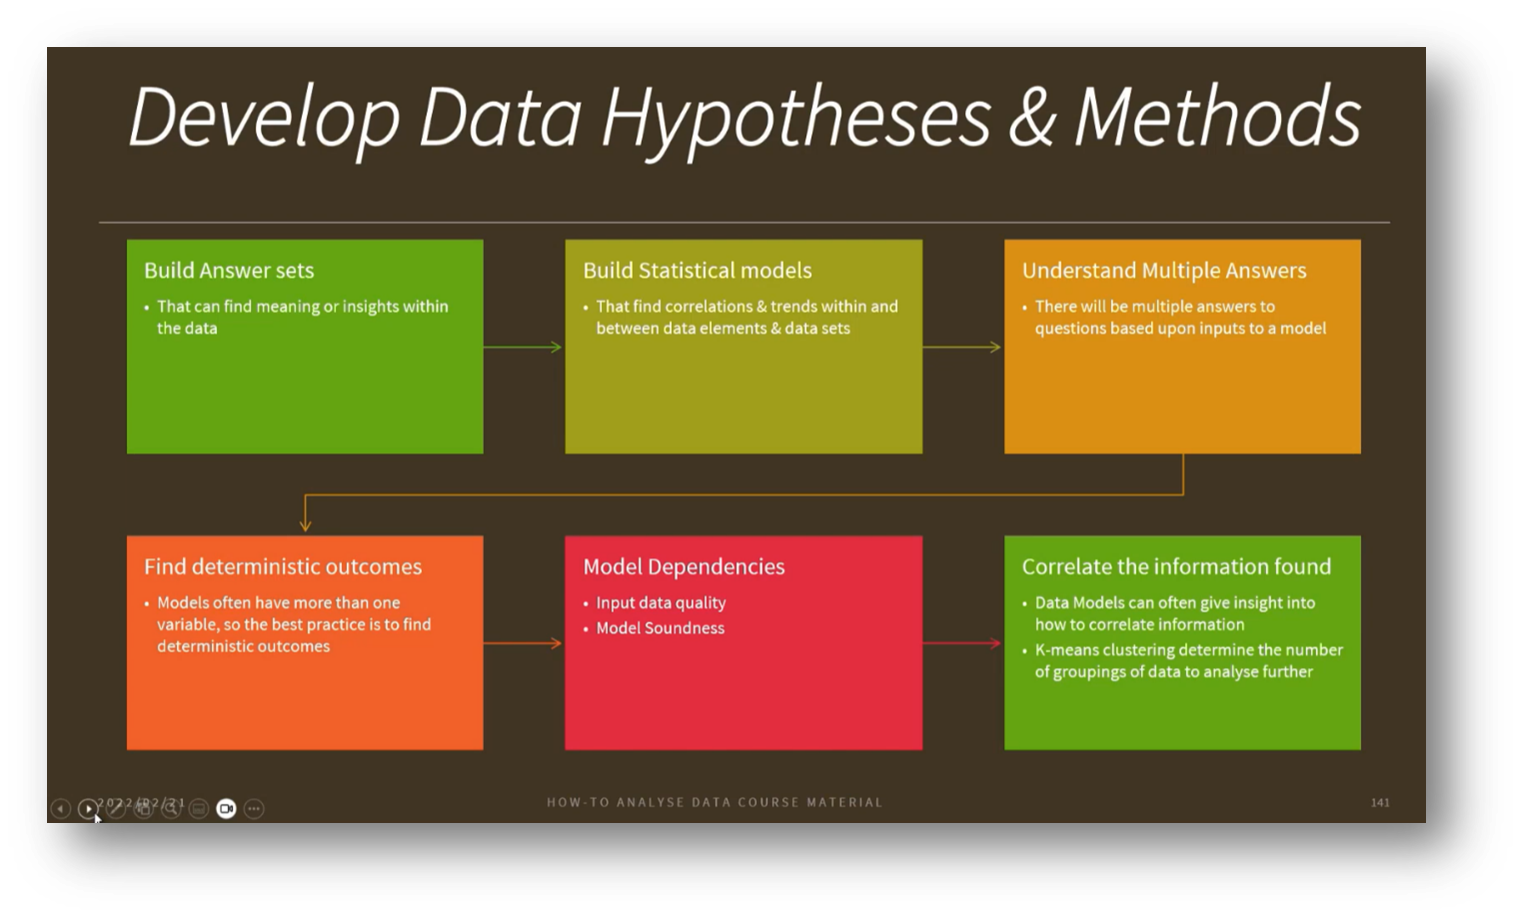
Figure 30 Develop Data Hypotheses & Methods
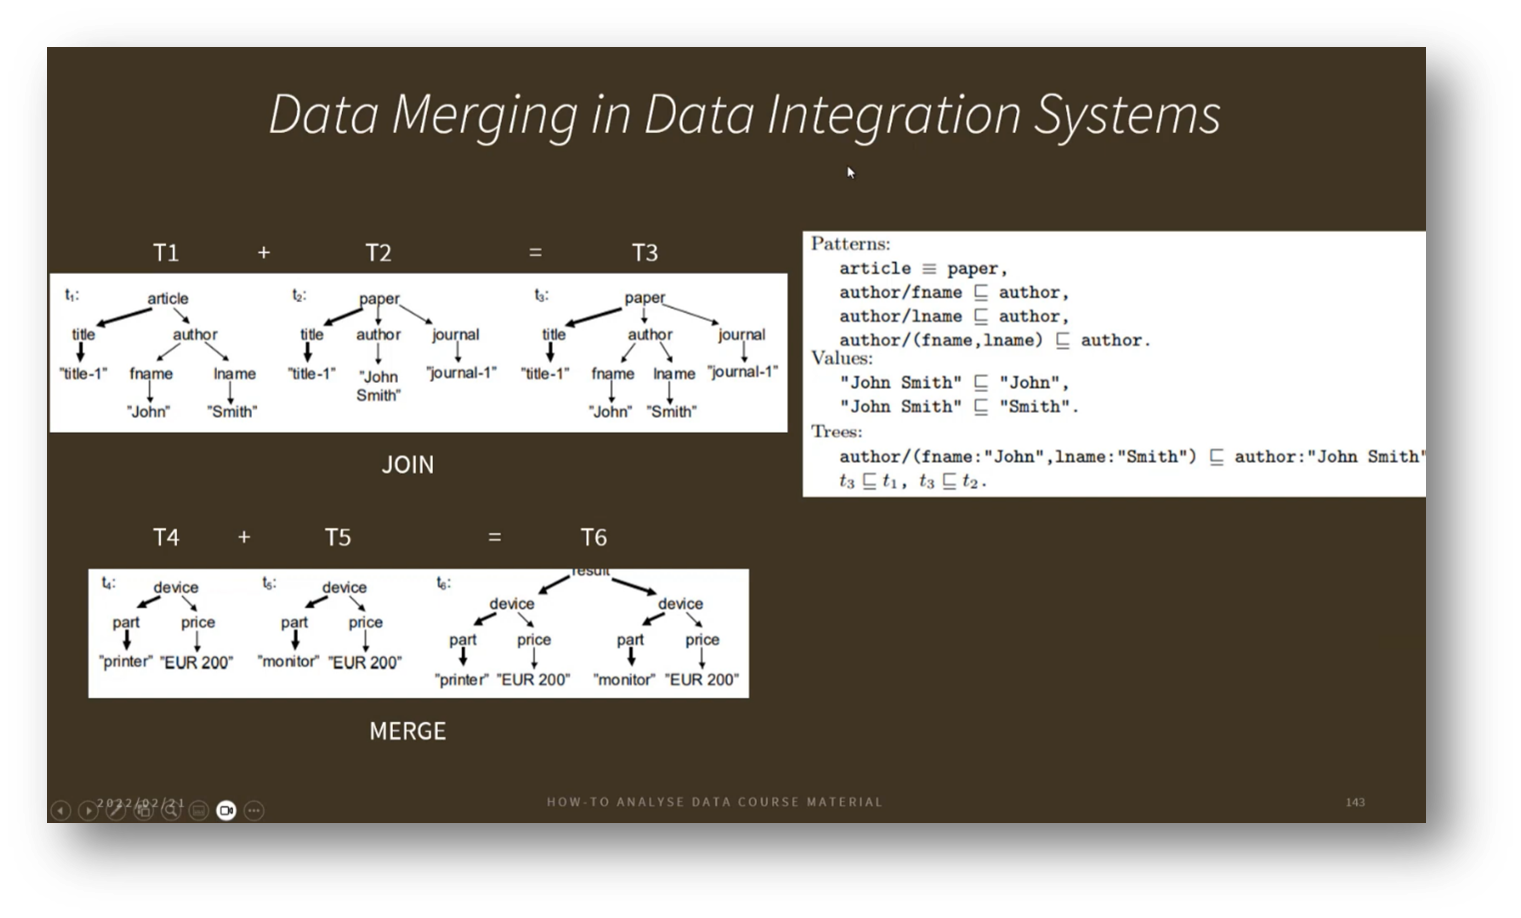
Figure 31 Data Merging in Data Integration Systems
The Intersection of Statistical Modelling and Machine Learning
In the realm of predictive modelling, we differentiate between statistical modelling and machine learning models. While statistical modelling often focuses on prediction through approximation, machine learning employs algorithms to analyse decision-making probabilities. Key to these processes is the careful selection of training and testing samples from the available dataset, which can consist of millions of records. For instance, a training-to-testing ratio of 50/50 or 80/20 might be used to ensure the model is adequately trained to produce reliable outcomes. Additionally, techniques such as dimensionality and feature reduction can help streamline the process by minimising the data required for training. Once the model is trained, it is validated using test data, followed by optimisation and refinement as new data becomes available.
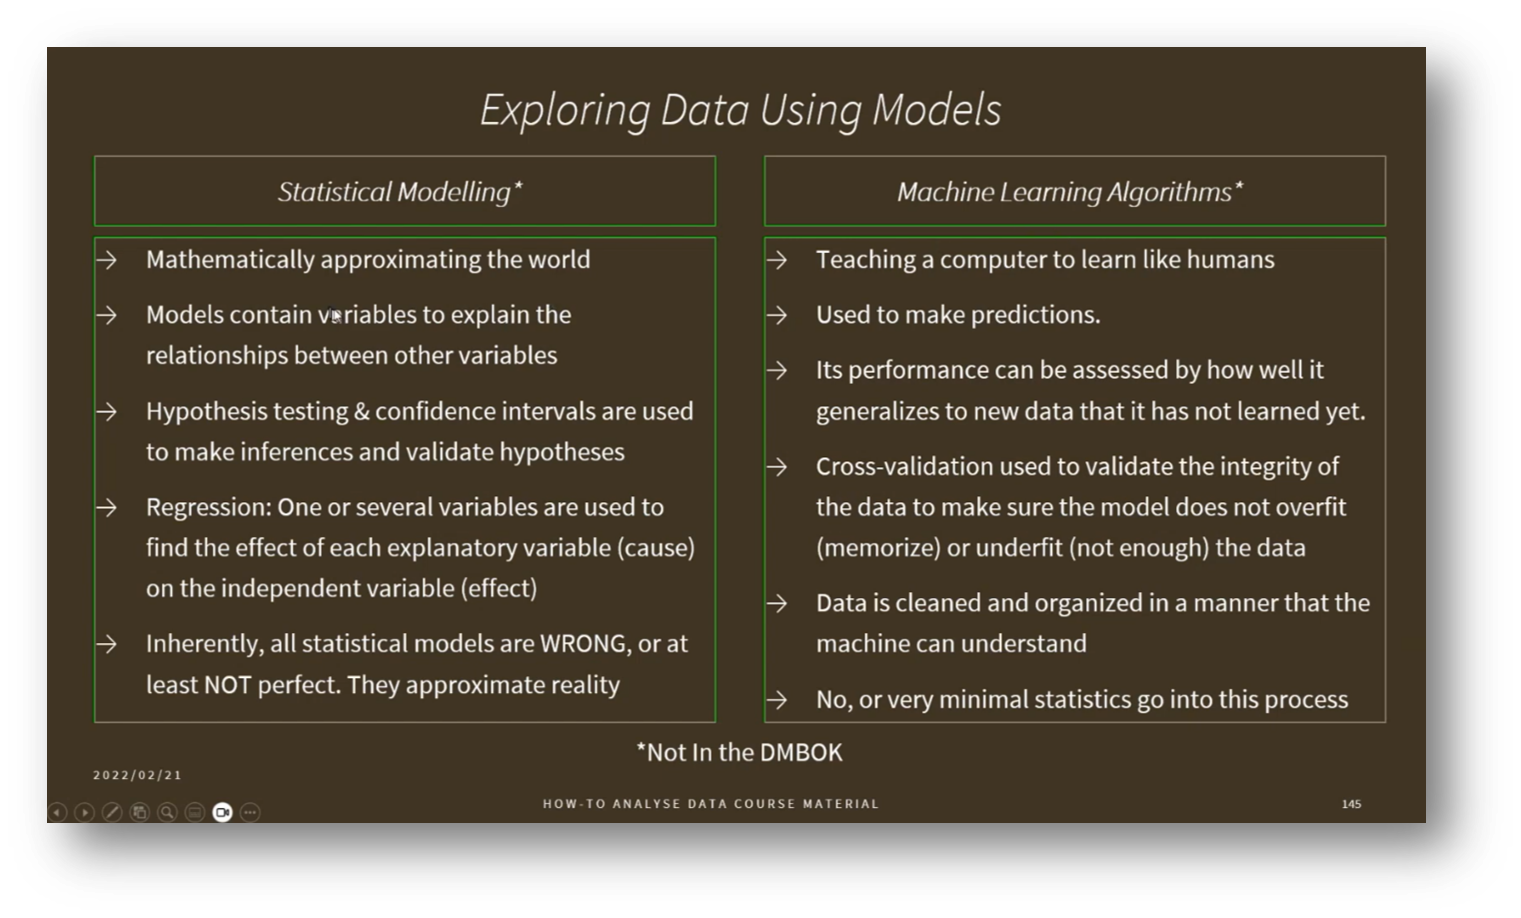
Figure 32 Exploring Data Using Models
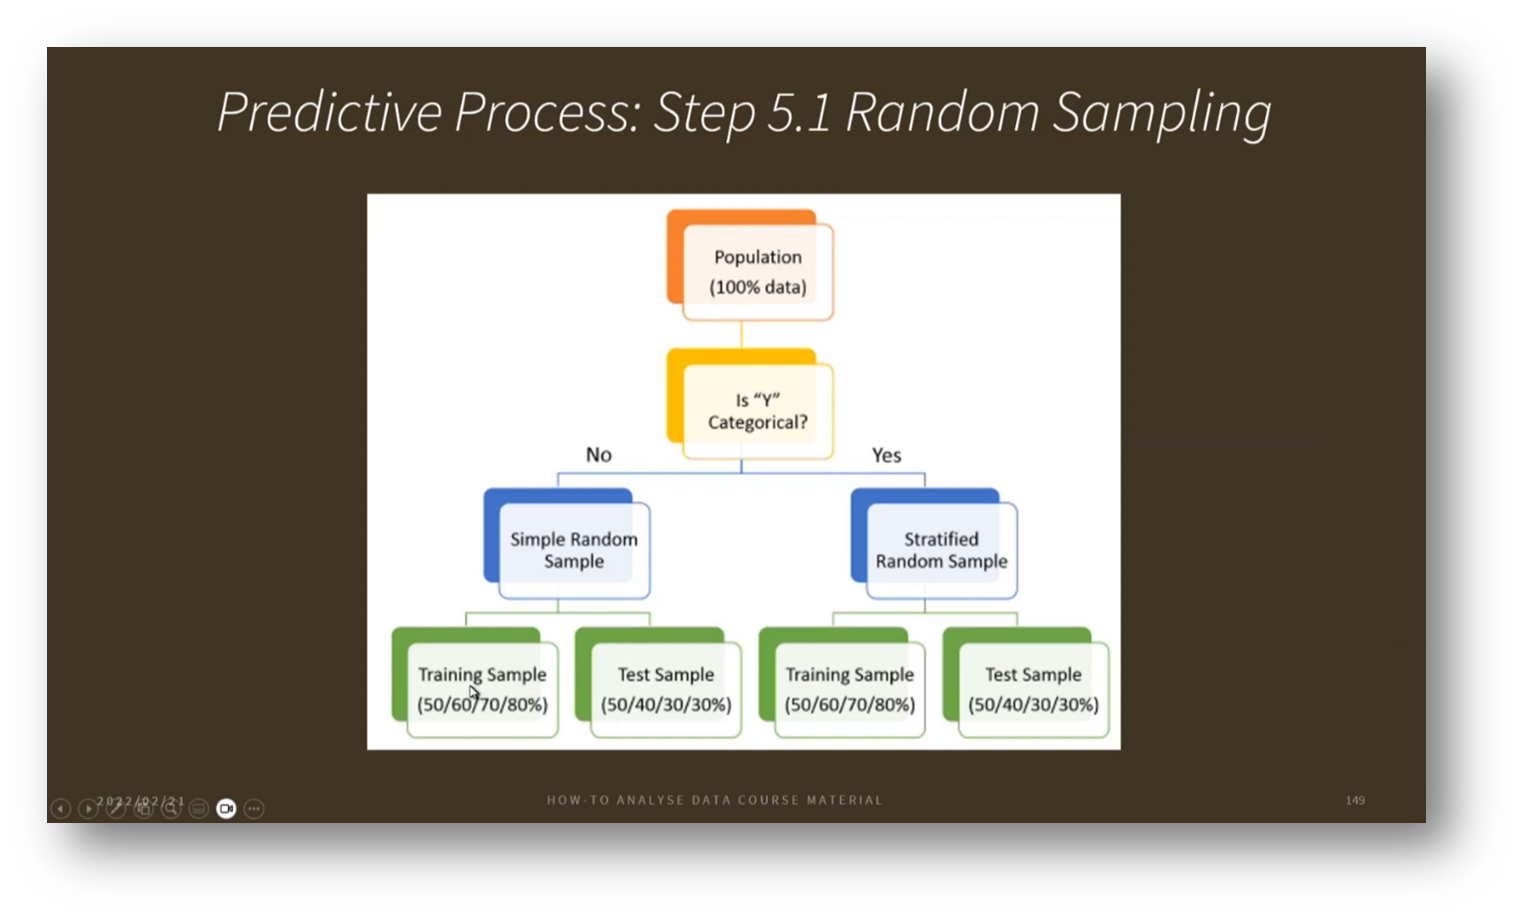
Figure 33 Predictive Process: Step 5.1 Random Sampling
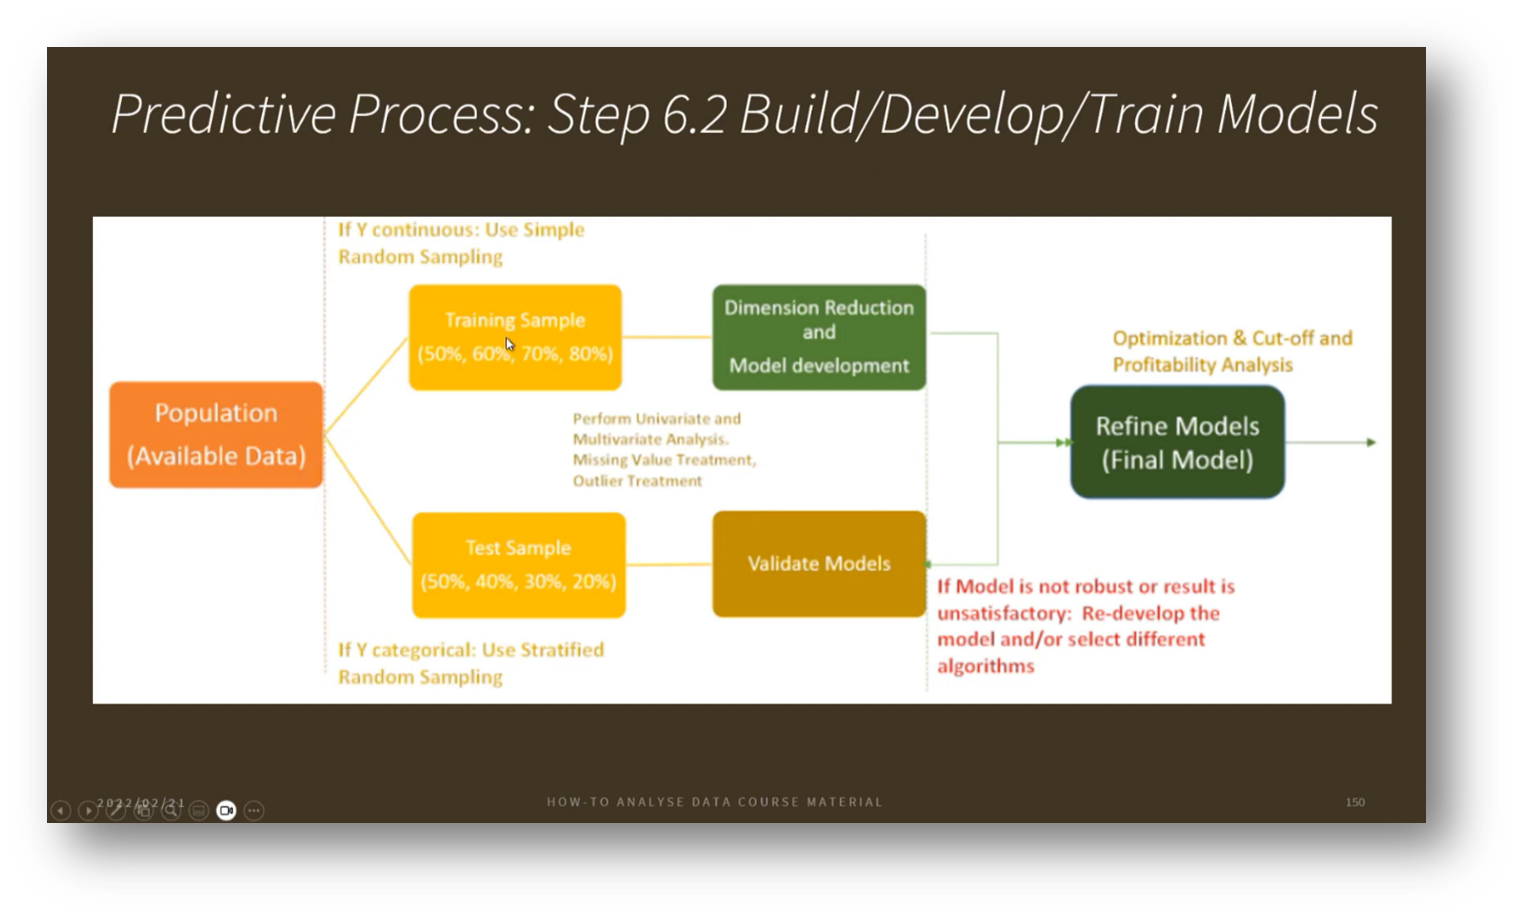
Figure 34 Predictive Process: Step 6.2 Build/Develop/Train Models
Monitoring Machine Learning Models in Data Management
Data professionals must understand the usage and processes involved in determining when a model is ready for production and ensure its accuracy. Deployment is not the end; continuous monitoring of outcomes and error rates is essential. If error rates increase, the model may need to be reverted to a test environment for troubleshooting, which could involve retraining with additional features.
Assessing model performance through true negatives, false positives, false negatives, and true positives is crucial for maintaining its effectiveness. Various visualisation techniques can help illustrate time series data, expectations, and relationships, allowing for deeper insights into model performance and informing decisions about its continued use or potential retirement.
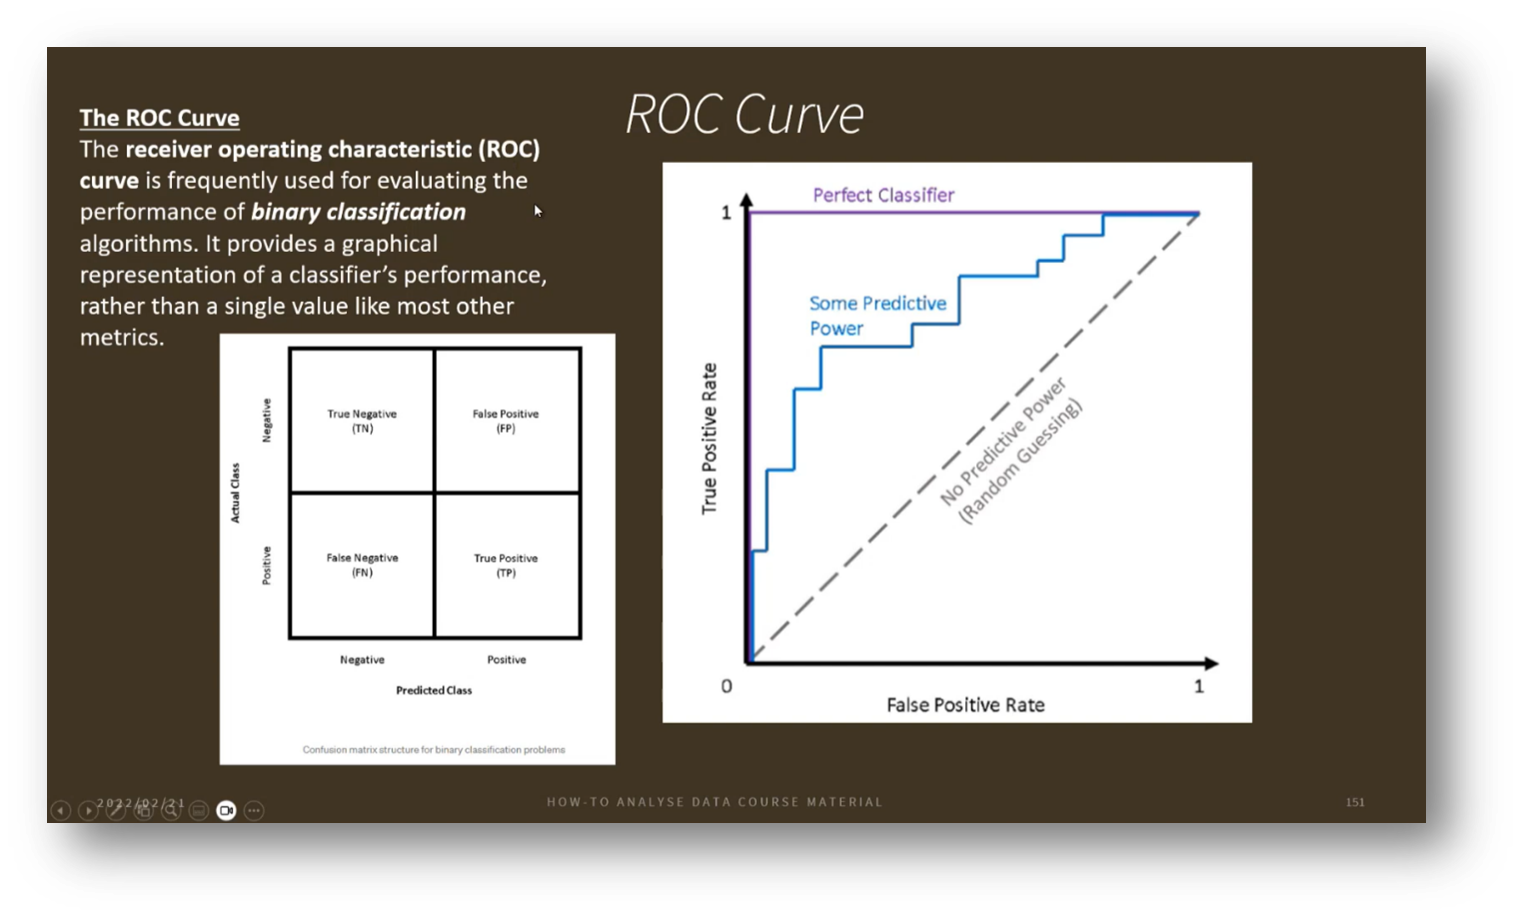
Figure 35 ROC Curve
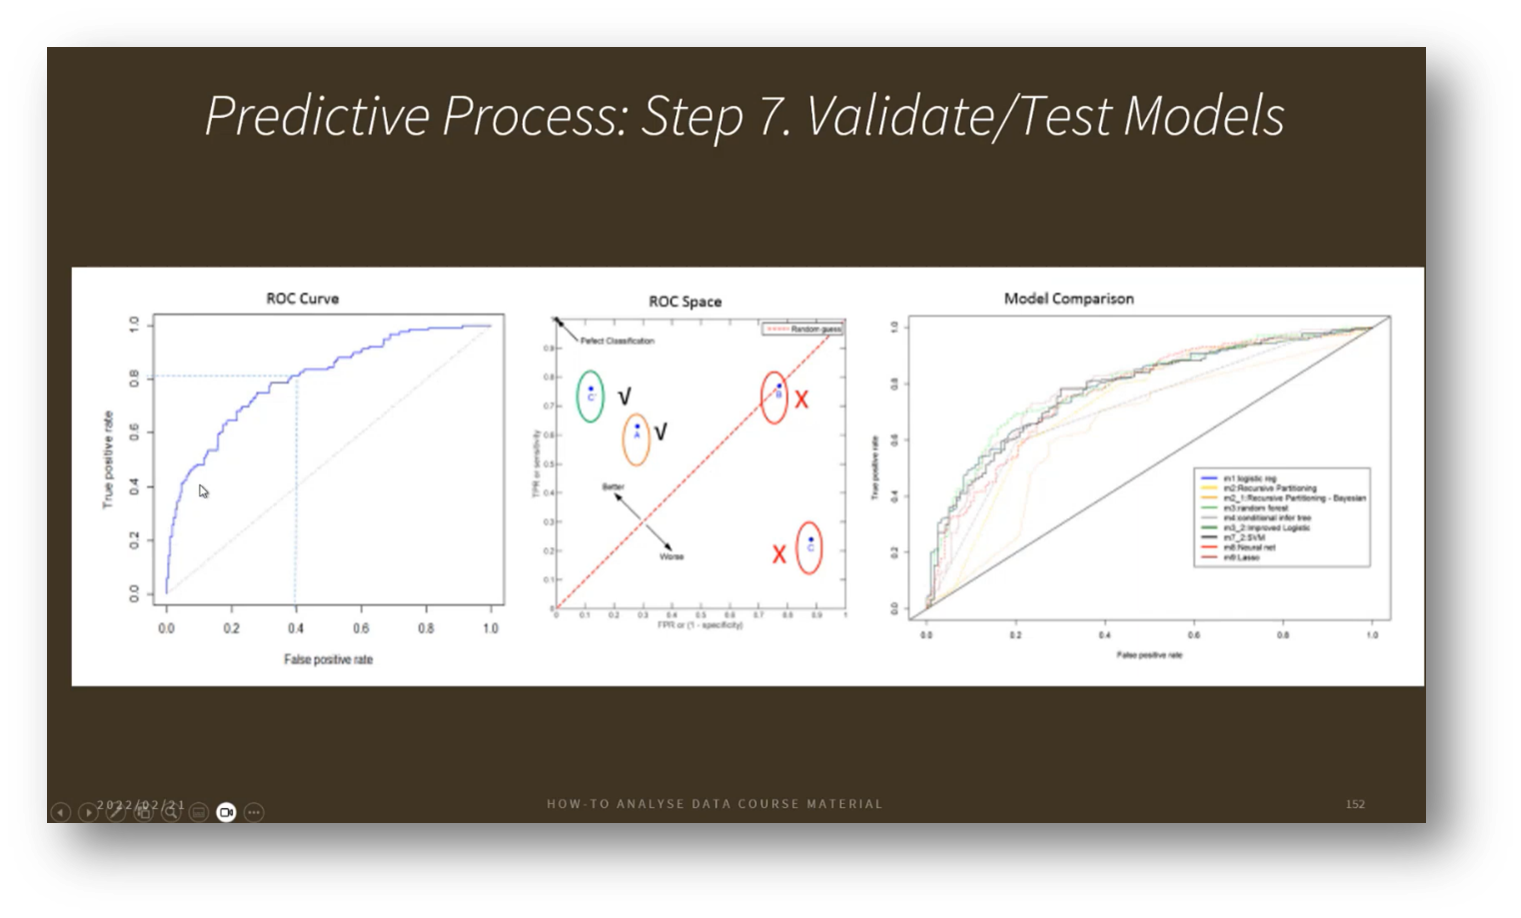
Figure 36 Predictive Process
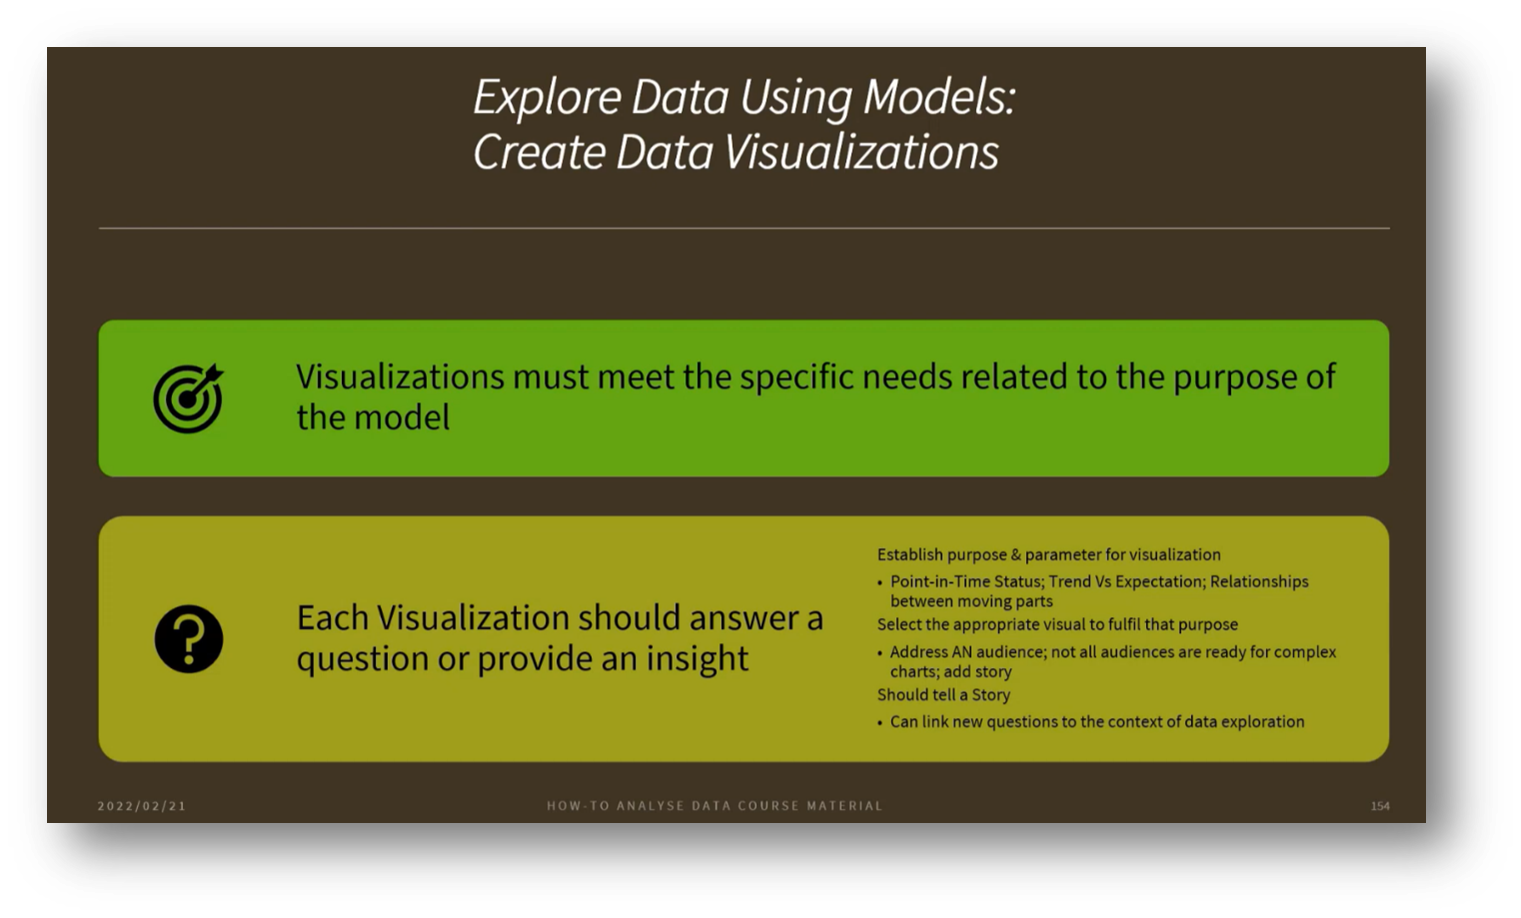
Figure 37 Explore Data Using Models
Data Deployment and Monitoring in Data Warehousing and Machine Learning
In the process of deploying and monitoring models, various stages are identified as blue, red, and green models. The green model typically represents the one currently in production, while the blue and red models are in the testing phase. This framework allows for comparisons between the different models, facilitating performance evaluation by analysing the outputs of each. The DMBoK framework aims to clarify the distinctions between areas such as Data Warehousing, Business Intelligence (BI), and machine learning Data Science, highlighting the processes involved in these domains.
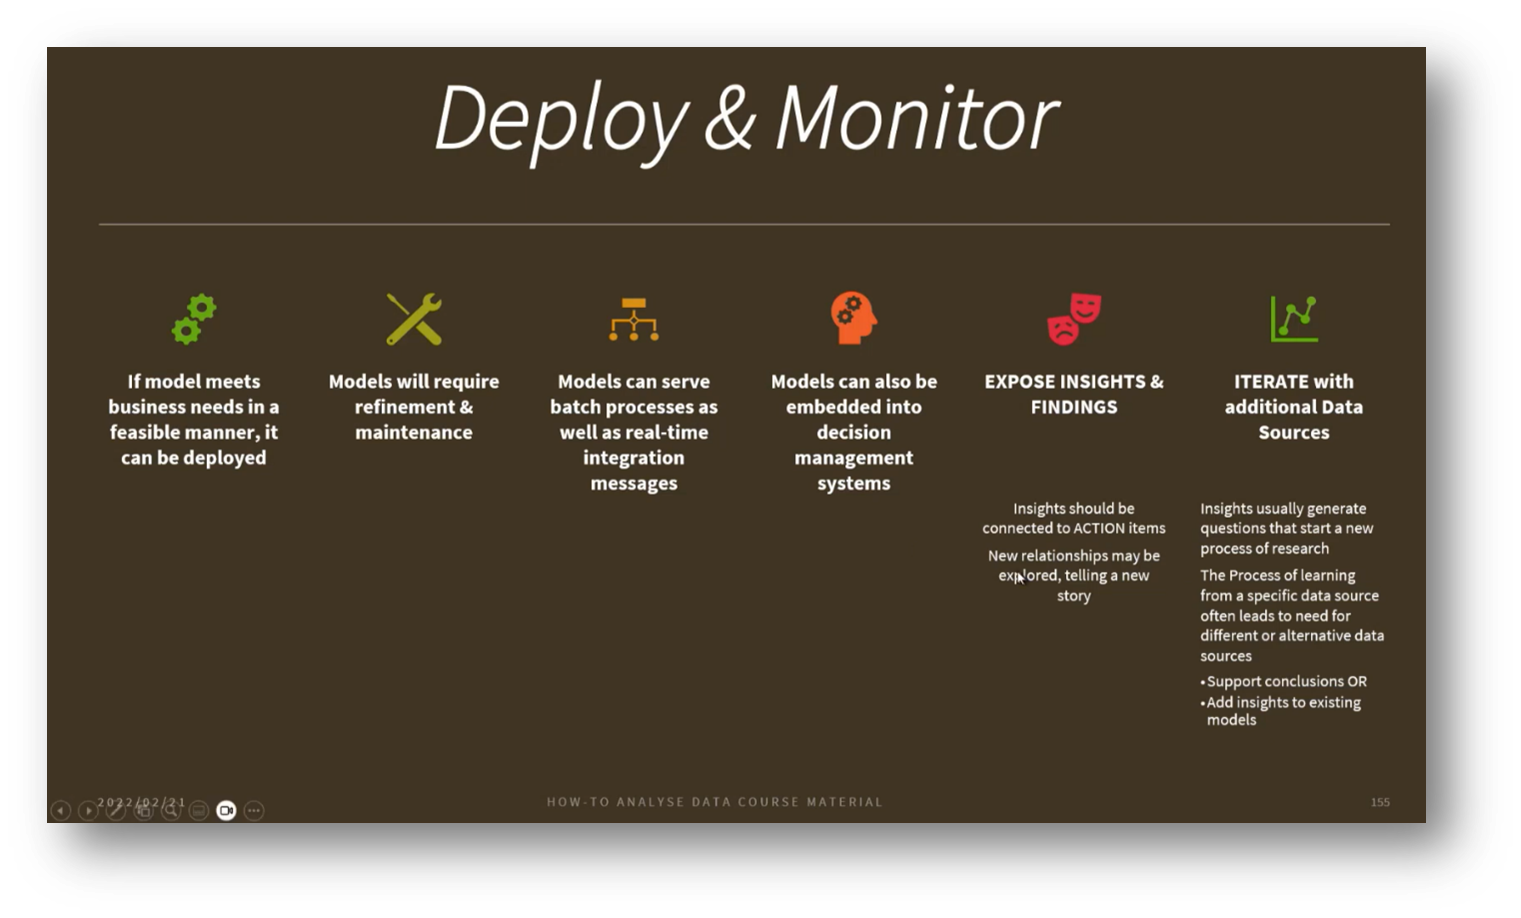
Figure 38 Deploy & Monitor
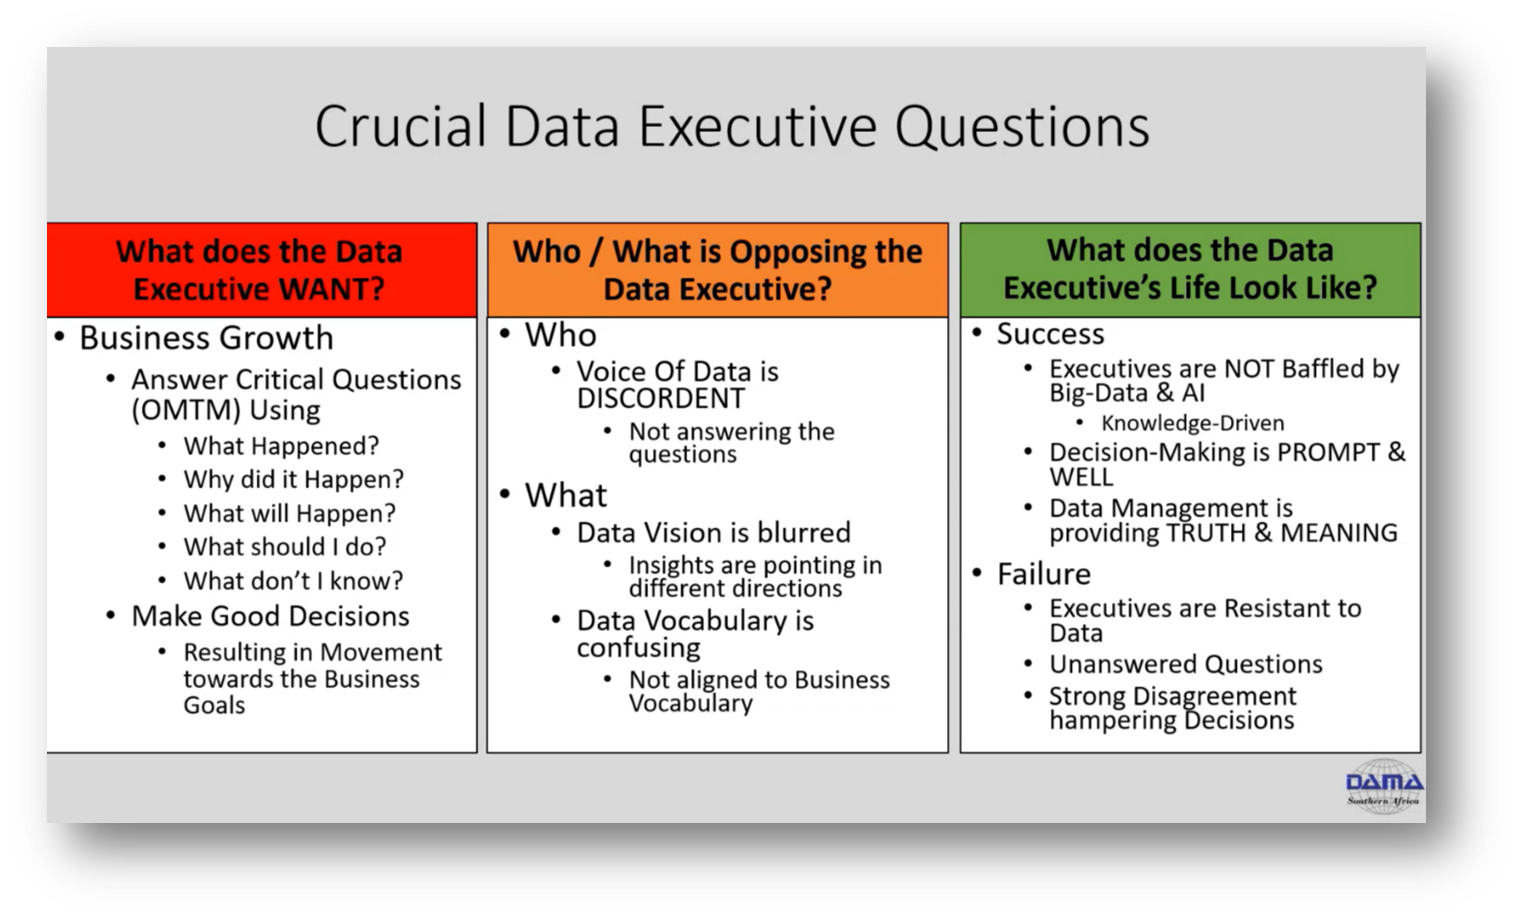
Figure 39 Crucial Data Executive Questions
The Importance of Ontology in Data Mapping and Integration
The discussion emphasises the critical role of ontologies in consolidating diverse data from various medical laboratories participating in the genome project. With numerous research data sets collected in different formats, integrating this information into a standardised layout is essential for efficiency and effectiveness. As data sources multiply, reliance on Metadata and a machine-readable ontology becomes vital, enabling seamless transformations and mappings between datasets. This approach not only addresses the challenges posed by unstructured data but also facilitates a unified view of research findings, as illustrated by collaborative efforts in astronomy to synthesise observations from hundreds of observatories worldwide. Ultimately, establishing a coherent mapping from source to target data is crucial for advancing research and providing clear insights into complex data landscapes.
Data Management and Analysis in Healthcare and Smart Cities
Data Warehousing and integration involve a structured management process centred around data architecture, technology requirements, and Business Intelligence tools, emphasising crucial components like data integration, ETL processes, Data Quality, and Metadata Management. Understanding data source characteristics is vital for effective integration, while the Gartner analytics framework highlights the role of people, processes, platforms, and Metadata.
In Data Science, the focus is on managing large datasets to extract insights, with an emphasis on ongoing hypothesis development and data storytelling. The rise of synthetic data for machine learning training necessitates robust governance to mitigate biases and ensure ethical considerations are met. Choosing appropriate data sources requires careful assessment that is aligned with specific use cases to enhance Data Governance. Additionally, the intersection of statistical modelling and machine learning distinguishes between approximation-focused statistical models and algorithm-driven predictive analysis, facilitating advancements in understanding complex datasets.
Managing Machine Learning Models in Changing Data Scenarios
When dealing with transitional data that changes frequently, it's crucial to monitor machine learning (ML) models for drift, which indicates that the relationships between features may be shifting in the real world. This drift can affect the model's accuracy, necessitating a review of parameters and potentially a model update. It's important to assess the impact of new data on the current model to determine if it requires retraining or if it can continue functioning effectively. Researchers recommend exploring techniques to measure and detect ML drift to manage this process effectively.
Feature and Dimension Reduction in Model Building
The process of building predictive models involves crucial steps like dimension reduction and feature engineering, as including too many features can complicate training and increase the challenges of handling permutations. It is essential to identify and isolate the multivariate relationships among features while removing extraneous ones, as this allows for a clearer analysis of the model's performance. Throughout this process, one may encounter an increase in false positives and false negatives, necessitating a reassessment of the relationships among features to ensure that significant factors are not overlooked. Howard closes with the recommendation of continuous monitoring and re-evaluation to maintain the model's effectiveness.
If you would like to join the discussion, please visit our community platform, the Data Professional Expedition.
Additionally, if you would like to be a guest speaker on a future webinar, kindly contact Debbie (social@modelwaresystems.com)
Don’t forget to join our exciting LinkedIn and Meetup data communities not to miss out!